Showing posts with label Household Debt. Show all posts

Friday, February 15, 2013

The Current State of Macroeconomics


1) Against Friedman: Why Assumptions Matter by Unlearningecon @ Unlearning Economics

In my opinion, Friedman’s essay is incoherent even on its own terms. He does not define the word ‘assumption,’ and nor does he define the word ‘prediction.’ The incoherence of the essay can be seen in Friedman’s own examples of marginalist theories of the firm. Friedman uses his new found, supposedly evidence-driven methodology as grounds for rejecting early evidence against these theories. He is able to do this because he has not defined ‘prediction,’ and so can use it in whatever way suits his preordained conclusions. But Friedman does not even offer any testable predictions for marginalist theories of the firm. In fact, he doesn’t offer any testable predictions at all.
Friedman’s essay has economists occupying a strange methodological purgatory, where they seem unreceptive to both internal critiques of their theories, and their testable predictions. This follows directly from Friedman’s ambiguous position. My position, on the other hand, is that the use and abuse of assumptions is always something of a judgment call. Part of learning how to develop, inform and reject theories is having an eye for when your model, or another’s, has done the scientific equivalent of jumping the shark. Obviously, I believe this is the case with large areas of economics, but discussing that is beyond the scope of this post. Ultimately, economists have to change their stance on assumptions if heterodox schools have any chance of persuading them.
Woj’s Thoughts - This essay by Friedman, The Methodology of Positive Economics, marked the beginning of my PhD program and helped shape my views about mainstream economics. Despite our (Unlearning Econ and mine) very different backgrounds, as usual, I came to a very similar conclusion:
Friedman sets out on the difficult task of developing a positive economics with normative implications. While his efforts to prove that a hypothesis must not be judged solely by the realistic nature of its assumptions were valiant, this strength of his paper has been largely overlooked. Instead, Friedman’s normative views regarding determination of a theory’s validity, choosing among competing valid hypotheses and application to specific circumstances have indoctrinated economists with a means to defend orthodox, mainstream economics from all criticism.
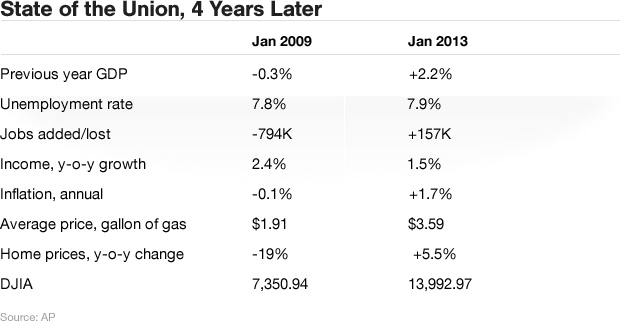


2) The State of the Economic Union by Dan Kervick @ New Economic Perspectives

The Most Urgent Problems We Face
2. Working People and Capital Moving in Opposite Directions

  • Corporate profits are up 36% since January 2008, and up 200% since January 2001.
  • The share of national income going to working people has fallen 6.2% since January 2008, and 11.2 % since January 2001.
  • For the bottom fifth of wage earners, the number of annual hours worked increased by 22% between 1979 and 2007, but real hourly wages increased by only 7.7%.  For the period between 2000 and 2007, real wages in this group actually fell by 3.2%

3. An Unstable Financial Economy

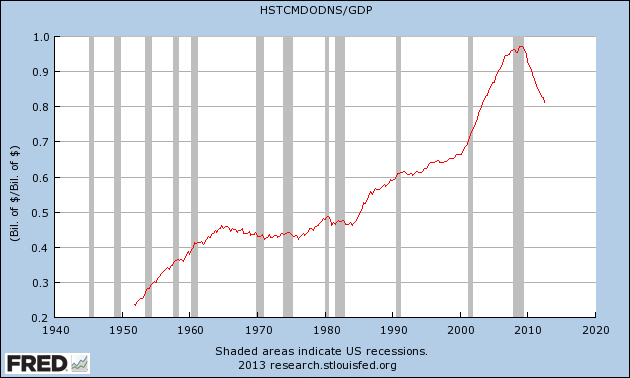
  • Although household debt has declined since the peak of the recession, it remains very high by historic standards.  Total household credit market liabilities as a share of GDP are now over 81%.  This compares to 43% in 1970, 49% in 1980, 60% in 1990, and 67% in 2000.
  • The financial sector remains dangerously large, and growing, with an 8.4% share of GDP – bigger than it was just before the recession.  The US financial industry now accounts for 30% of all domestic corporate profits.
  • The total outstanding debt of the domestic financial sector is over 87%, down from 107% at the beginning of 2007, but still much higher than in January 2000 (80%), January 1990 (44%) and January 1980 (19%).

4. Socioeconomic Inequality

  • The after tax income of the top 1% of households, adjusted for inflation, has risen by about 130% since 1967.  The income of the next 20% has risen by 28%.  The incomes of all other income groups have fallen.
  • The richest 1% of Americans control 34.6% of Americans’ net worth.  The bottom 90% control 26.9% of net worth.

Woj’s Thoughts - Dan lays out seven different problems that currently plague America, of which three are listed above. These specific selections were chosen because I personally found them most compelling, as presented, not to imply they’re the most important. Dan also presents five immediate actions the federal government could take to address these issues. I don’t necessarily support all of the proposals but they represent a good starting point for debating how to best turn the economy around.

Monday, February 11, 2013

The Rise of Debt, Interest, and Inequality

According to Paul Krugman, he’s “had a mild-mannered dispute with Joe Stiglitz over whether individual income inequality is retarding recovery right now.” Since both Nobel Laureates were focusing on gross private savings, I broke down that measure by individual components and sub-components. Insights gained from those charts led to the conclusion that:
This data is consistent with rising income and wealth inequality but requires reversing Stiglitz’s “underconsumption” hypothesis. Trying to maintain relative consumption levels, many households clearly chose to rely on previous savings or new debt as a means of temporarily boosting consumption. As inequality continues to rise, wealthy households are now electing to retain more of their savings within corporations. It doesn’t take a leap of faith to suggest this combination of factors depresses aggregate demand.
Still unconvinced, Krugman has been searching for further data (see here and here) that would lead him to believe inequality really is holding back the recovery.

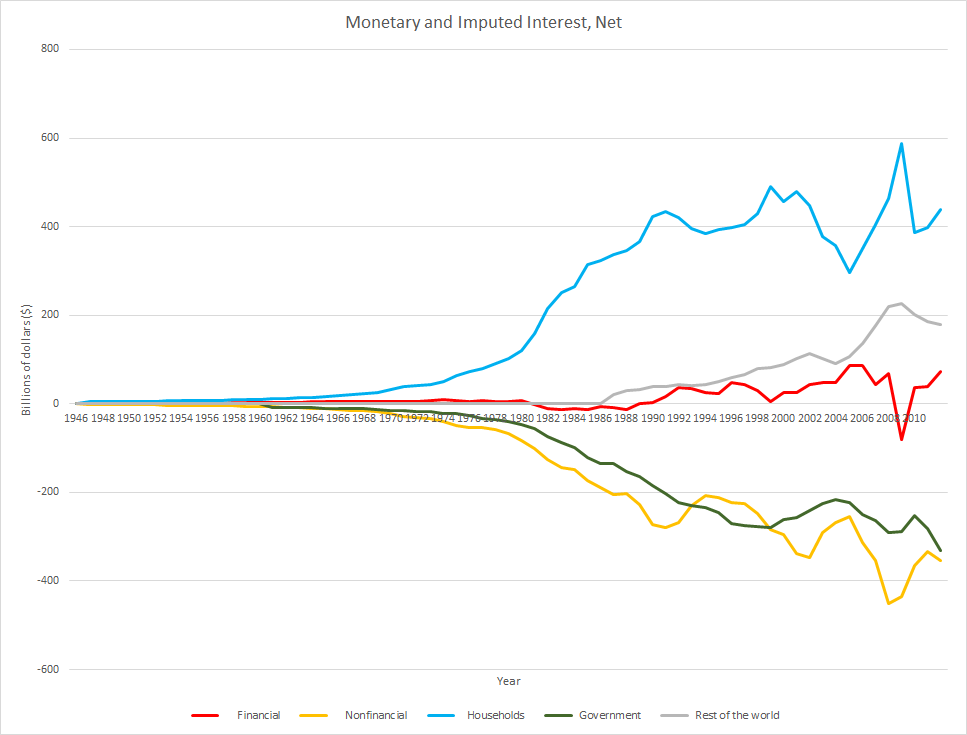
Hoping to aid Krugman in his quest and expand upon my “overconsumption” theory, let me respond to a critique of the previous post. Over at Mike Norman Economics, a commenter (Ryan Harris) kindly noted the obvious omission of interest income and sectoral balances. After sorting through interactive data from the Bureau of Economic Analysis, here are net amounts of monetary and imputed interest by sector [positive (negative) total implies sector receives (pays) net interest]:


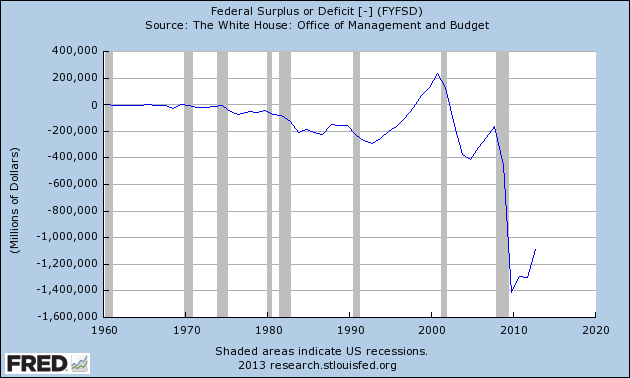
Unsurprising to those familiar with sectoral balance analysis, households net interest position took a sharp turn upwards when federal budget deficits began expanding more rapidly in 1980:

Around the same time, household interest income received a significant boost from the nonfinancial business sector. The pronounced decline in the net interest position of that sector aligns closely with high interest rates of the preceding period and a massive expansion of nonfinancial corporate debt shortly afterwards:

Since then the rise and fall of nonfinancial interest payments (and outstanding debt) has tracked the business cycle, with the overall trend remaining steadily lower (higher net payments and outstanding debt). Although these transfers support household income, they also increase income inequality since wealthy households hold a vast majority of financial assets (including corporate debt).

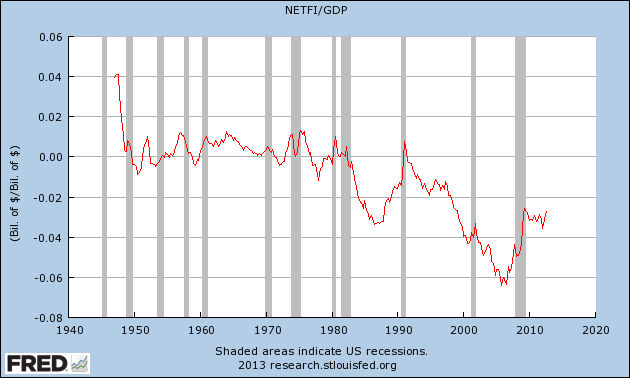
Turning to the foreign (rest of the world) sector, the U.S. current account (trade) balance fell heavily in the 1990’s:

Foreign countries began amassing large quantities of U.S. financial assets (primarily Treasuries) corresponding to the substantial trade deficits. The growth in net interest receipts arising from these holdings represents an ongoing leak in domestic aggregate demand.
   
With the beginning of a new millennium and the dot-com bubble, a hostile environment was created for the household net interest position. Federal budget surpluses, declining interest rates, rapidly expanding trade deficits, and increasing payments to the financial sector (for housing) led to a nearly 40% decline in household net interest receipts. Combined with increasing income inequality, many households drew upon savings and increased demand for new debt to maintain previous levels of consumption.

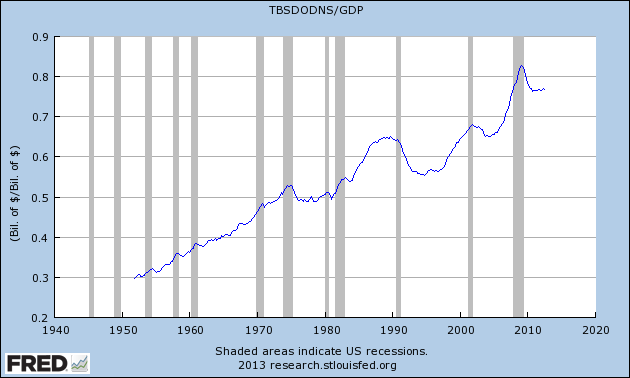
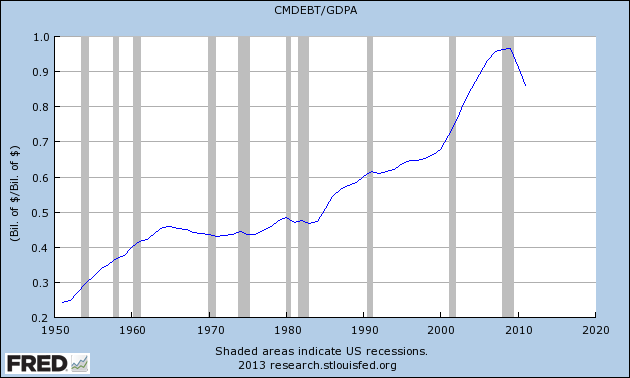
A side effect of the budget surpluses was a growing desire for safe financial assets separate from U.S. Treasuries. Securitization provided a means for new loans of varying risk to be converted into supposedly “super-safe” assets and transferred off of bank’s balance sheets. These factors encouraged banks to meet the surging demand for new loans coming from households (Chart: Household Debt-to-GDP):

The effects of these transactions can also be seen in the transfer of net interest payments from households, and later businesses, to the financial sector. Apart from adding to inequality, these transfers reduce aggregate demand since, as Michael Hudson notes in The Bubble and Beyond, “financial institutions tend to save all their income.” (2012: Kindle Locations 6814-6815)

Since the financial crisis ended, the trend towards higher net interest receipts by the financial sector and greater net interest payments by the nonfinancial corporate sector have returned. These transfers of income up the income/wealth ladder serve to exacerbate the weak demand stemming from two decades of stagnating household interest income. Unfortunately, and so far unsuccessfully, public policy (fiscal and monetary) remains dedicated to originating a new private debt led boom.  

The changes in net interest payments/receipts over the past few decades highlight the growing income and wealth disparities present in our society. For many years households dug themselves deeper in debt to maintain relative consumption levels. The costs of excessively accumulating private debt have now been recognized, but the burden of interest payments suppressing aggregate demand will be felt for years to come.  

  
Bibliography
Hudson, Michael (2012-10-04). THE BUBBLE AND BEYOND (Kindle Locations 6814-6815). ISLET. Kindle Edition.

Wednesday, February 6, 2013

Inequality Really Is Holding Back the Recovery

A couple weeks ago Nobel Laureate Joseph Stiglitz generated a heated debate among economists by claiming “Inequality Is Holding Back the Recovery.” Paul Krugman, another Nobel Laureate who is normally on Stiglitz’s side in these debates, actually took a somewhat opposing position:
First, Joe offers a version of the “underconsumption” hypothesis, basically that the rich spend too little of their income. This hypothesis has a long history — but it also has well-known theoretical and empirical problems.
It’s true that at any given point in time the rich have much higher savings rates than the poor. Since Milton Friedman, however, we’ve know that this fact is to an important degree a sort of statistical illusion. Consumer spending tends to reflect expected income over an extended period. If you take a sample of people with high incomes, you will disproportionally include people who are having an especially good year, and will therefore be saving a lot; correspondingly, a sample of people with low incomes will include many having a particularly bad year, and hence living off savings. So the cross-sectional evidence on saving doesn’t tell you that a sustained higher concentration of incomes at the top will lead to higher savings; it really tells you nothing at all about what will happen.
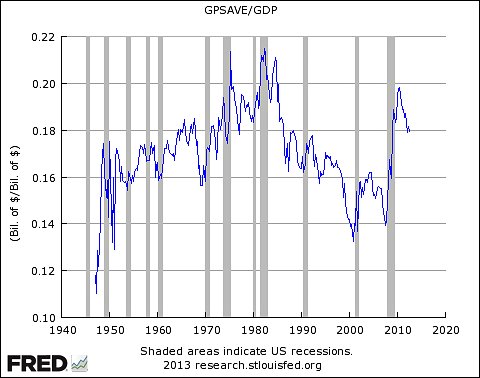
So you turn to the data. We all know that personal saving dropped as inequality rose; but maybe the rich were in effect having corporations save on their behalf. So look at overall private saving as a share of GDP:
The trend before the crisis was down, not up — and that surge with the crisis clearly wasn’t driven by a surge in inequality.
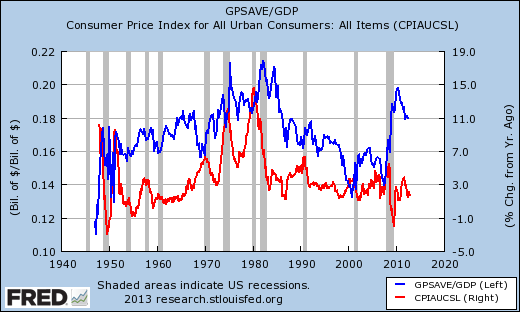
Not convinced by Krugman’s analysis, Arthur Shipman considers other potential reasons that gross saving might have fallen in response to rising inequality. As he wisely points out, the above trend is reminiscent of the change in inflation rates:
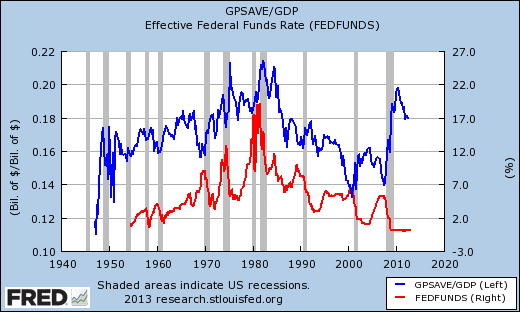
and even more so, the pattern of interest rates:
Still unsatisfied, Arthur concludes:
So are there a lot of explanations for why Krugman's graph goes up and down?
There must be.

While I won’t disagree with Arthur’s conclusion, I think a potentially satisfying explanation does exist if one disaggregates gross private saving.

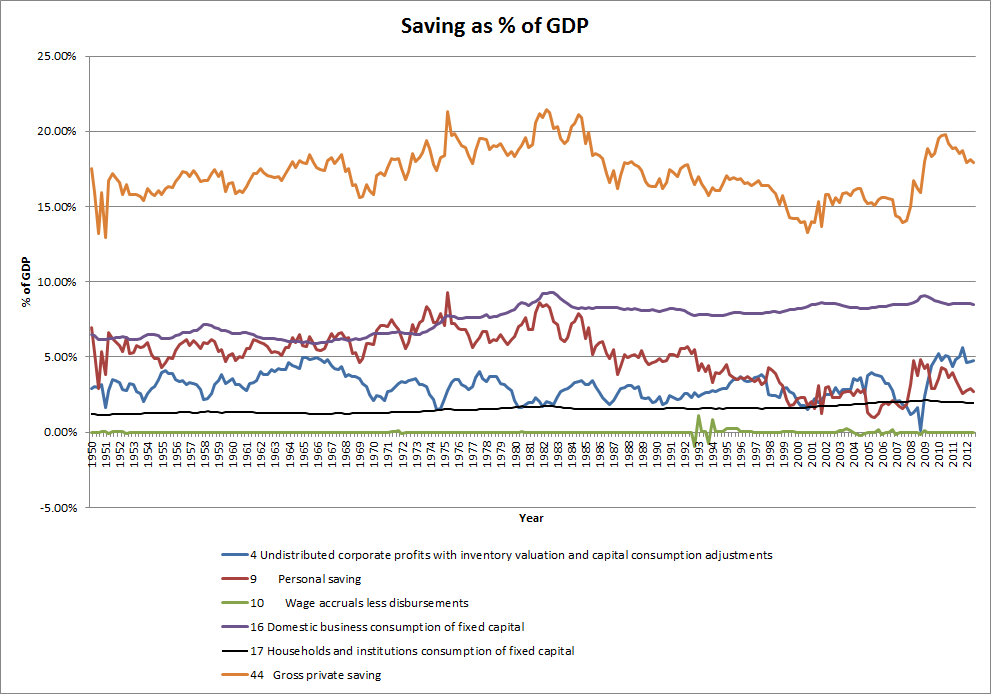
Gross private saving = personal saving + wage accruals less disbursements + consumption of fixed capital (domestic business + households and institutions) + undistributed corporate profits with inventory valuation and capital consumption adjustments.

Using interactive data from the Bureau of Economic Analysis, Krugman’s chart can be recreated to depict each of the disaggregated measures as a percentage of GDP:
This chart makes it patently obvious that the sharp swings in gross private saving, as a percentage of GDP, are almost entirely due to changes in personal saving and undistributed corporate profits with inventory valuation and capital consumption adjustments.

Specifically focusing attention on the period from the mid-1980’s up to the recent crisis, the entire decline in gross private saving is basically due to declining personal saving. Can this observation be reconciled with rising inequality during the same time period?

In my view, the staggering fall in personal saving can not only be reconciled with rising inequality but also with declining inflation and interest rates. Rising income and wealth inequality starting in the 1980’s meant that many households could no longer maintain relative levels of consumption based solely on disposable income. Assuming this trend would not persist indefinitely, or maybe just unwilling to lower relative consumption, a proportion of households either drew upon previous savings or sought out loans (new debt) to temporarily raise consumption. As the upward trend in inequality persisted, more households elected to reduce savings or, having exhausted their savings, increase demand for debt.
Coincidently, inflation and interest rates were steadily declining during these years. Combined with numerous new debt subsidies and implicitly increasing federal backing, banks were all too eager to meet the rising demand for credit. This explosive expansion of credit is readily apparent in the following chart of household debt to GDP:


The concurrent drawing down of savings and growing stock of outstanding debt among households provides a very straightforward explanation for how inequality drove the observed decline in personal saving.

Returning to the disaggregated chart of saving as a percentage of GDP, the reasons behind the sharp rise during and after the recent crisis are also much clearer. On the household side, declining home values and rising unemployment clearly brought about a shift in personal saving. Having already amassed a large stock of debt, households were pressured to increase saving in order to meet the principal and interest payments coming due. Furthermore, recognition by many households that previous saving was insufficient for present retirement plans may have added to the rise in personal saving.

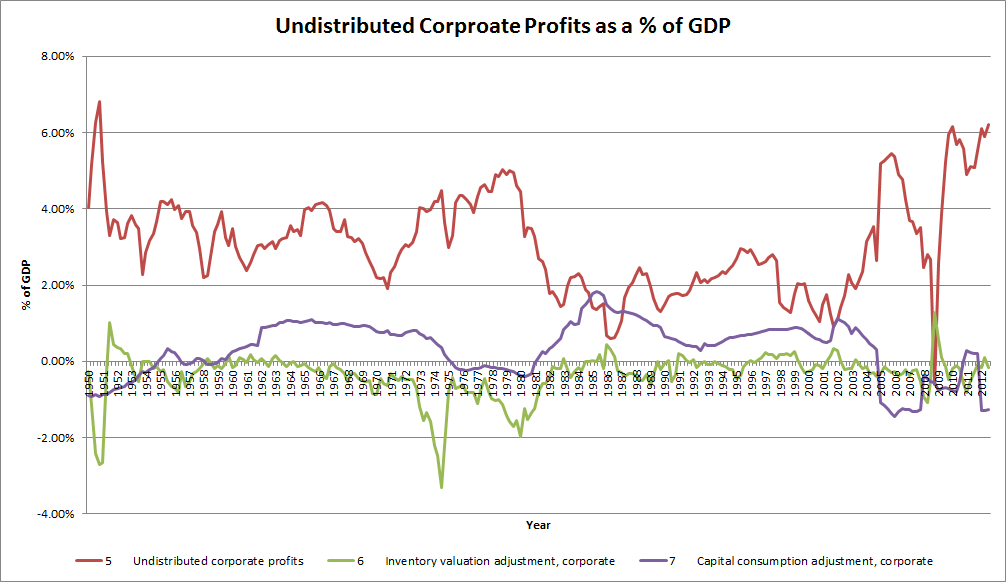
Switching to the corporate side, the change in undistributed corporate profits can also be disaggregated into its distinct parts:
The recent crisis saw an unparalleled fall and rise in undistributed corporate profits that returned the percentage to heights previously witnessed only briefly sixty years ago. It’s also worth noting that undistributed corporate profits had risen significantly following the bursting of the dot-com bubble. Contrary to Krugman’s claim, this suggests wealthy households were and are continuing to use corporations as a means of effective saving.  

By disaggregating the data for gross private savings, the drivers behind the large fluctuations and trends become increasingly apparent. This data is consistent with rising income and wealth inequality but requires reversing Stiglitz’s “underconsumption” hypothesis. Trying to maintain relative consumption levels, many households clearly chose to rely on previous savings or new debt as a means of temporarily boosting consumption. As inequality continues to rise, wealthy households are now electing to retain more of their savings within corporations. It doesn’t take a leap of faith to suggest this combination of factors depresses aggregate demand. Stiglitz is therefore correct in concluding:
Now we realize that we are paying a high price for our inequality and that alleviating it and promoting growth are intertwined, complementary goals. It will be up to all of us — our leaders included — to muster the courage and foresight to finally treat this beleaguering malady.

Wednesday, December 26, 2012

David Rosenberg's 2013 Investment Outlook

One of the best resources for investment advice and economic projections over the past several years has been David Rosenberg. Courtesy of Zero Hedge, here is part of his outlook for 2013:
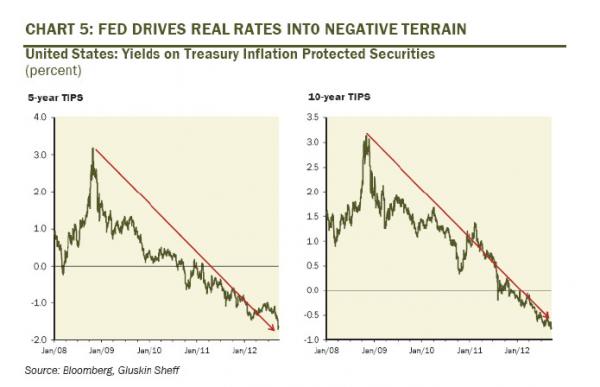
The Fed has also completely altered the relationship between stocks and bonds by nurturing an environment of ever deeper negative real interest rates. Therein lies the rub. The economy and earnings are weak, and getting weaker, but the Interest rate used to discount the future earnings stream keeps getting more and more negative, and that lowers the corporate cost of capital and in turn raises the present value of expected future profits. It's that simple.
...
Beneath the veneer, there are opportunities. I accept the view that central bankers are your best friend if you are uber-bullish on risk assets, especially since the Fed has basically come right out and said that it is targeting stock prices. This limits the downside, to be sure, but as we have seen for the past five weeks, the earnings landscape will cap the upside. I also think that we have to take into consideration why the central banks are behaving the way they are, and that is the inherent 'fat tail' risks associated with deleveraging cycles that typically follow a global financial collapse. The next phase, despite all efforts to kick the can down the road, is deleveraging among sovereign governments, primarily in half the world's GDP called Europe and the U.S. Understanding political risk in this environment is critical.
...
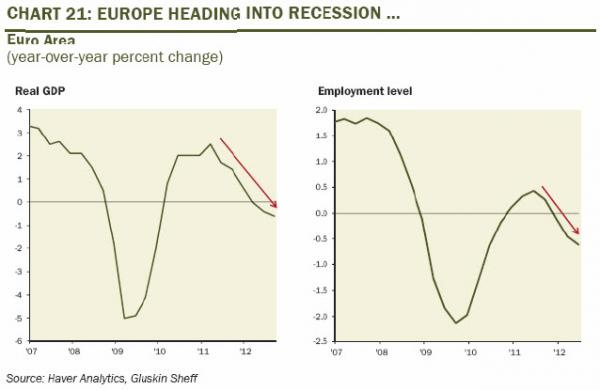
With regard to global events, we continue to monitor the European situation closely. Euro zone finance ministers have given Greece an additional two-year lifeline and the Greek parliament just passed another round of severe austerity measures, which I think will only serve to make matters worse there from an economic standpoint, but I doubt that the creditors are going to let Greece go just yet. So this never-ending saga remains a source of ongoing uncertainty, but at the same time. Is a key reason why the Fed and the Bank of Canada will continue to keep short-term interest rates near the floor, and all that means is to build even more conviction over income equity and corporate bond themes.
...
As for something new, after a rather significant slowdown in China for much of this year that put the commodity complex in the penalty box for a period of time, we are seeing some early signs of visible improvement in the recent economic data out of China and this actually has happened even in advance of any significant monetary and fiscal stimulus. And while the Chinese stock market has been a laggard, if there is one country that does have the room to stimulate, it is China (make no mistake, however, China's economic backdrop is still quite tenuous, especially as it pertains to the corporate sector - excessive inventories, stagnant profits, rising costs and lingering excess capacity are all challenges to overcome).
Keep in mind that much of this slowing in China was a lagged response to prior policy tightening measures to curb heightened inflationary pressures - pressures that have since subsided sharply with the consumer inflation rate down to 2% (near a three-year low) from the 6.5% peak in the summer of 2011 and producer prices are deflating outright. What is providing a big assist to this sudden reversal of fortune in China is a re-acceleration in bank lending as a resumption of credit growth and bond issuance has allowed previously- announced infrastructure projects out of Beijing (railways in particular) to get incubated.
The nascent economic turnaround we are seeing in China, if sustained, is Positive news for the commodity complex and in turn resource-sensitive currencies like the Canadian dollar, which I'm happy to report has hung in extremely well this year even in the face of all the global economic and financial crosscurrents. Just consider that the low for the year for the loonie was 96 cents - you have to go back to 1976 to see the last time intra-year lows happened at such a high level.
...
To reiterate, our primary strategy theme has been and remains S.I.R.P. - Safety and Income at a Reasonable Price - because yield works in a deleveraging deflationary cycle.Not only is there substantial excess capacity in the global economy, primarily in the U.S. where the "output gap" is close to 6%, but the more crucial story is the length of time it will take to absorb the excess capacity. It could easily take five years or longer, depending of course on how far down potential GDP growth goes in the intermediate term given reduced labour mobility, lack of capital deepening and higher future tax rates. This is important because what it means is that disinflationary, even deflationary, pressures will be dominant over the next several years. Moreover, with the median age of the boomer population turning 56 this year, there is very strong demographic demand for income. Within the equity market, this implies a focus on squeezing as much income out of the portfolio as possible so a reliance on reliable dividend yield and dividend growth makes perfect sense.
...
Gold is also a hedge against financial instability and when the world is awash with over $200 trillion of household, corporate and government liabilities, deflation works against debt servicing capabilities and calls into question the integrity of the global financial system. This is why gold has so much allure today. It is a reflection of investor concern over the monetary stability, and Ben Bernanke and other central bankers only have to step on the printing presses whereas gold miners have to drill over two miles into the ground (gold production is lower today than it was a decade ago - hardly the same can be said for fiat currency). Moreover, gold makes up a mere 0.05% share of global household net worth, and therefore, small incremental allocations into bullion or gold-type investments can exert a dramatic impact. Gold cannot be printed by central banks and is a monetary metal that is no government's liability. It is malleable and its supply curve is inelastic over the intermediate term. And central banks, who were selling during the higher interest rate times of the 1980s and 1990s, are now reallocating their FX reserves towards gold, especially in Asia. With the gold mining stocks trading at near record-low valuations relative to the underlying commodity and the group is so out of favour right now, that anyone with a hint of a contrarian instinct may want to consider building some exposure - as we have begun to do.
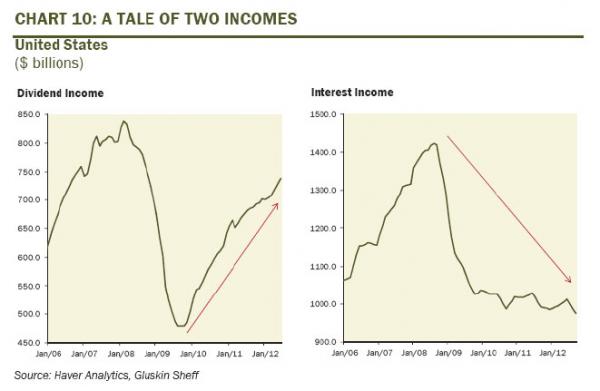
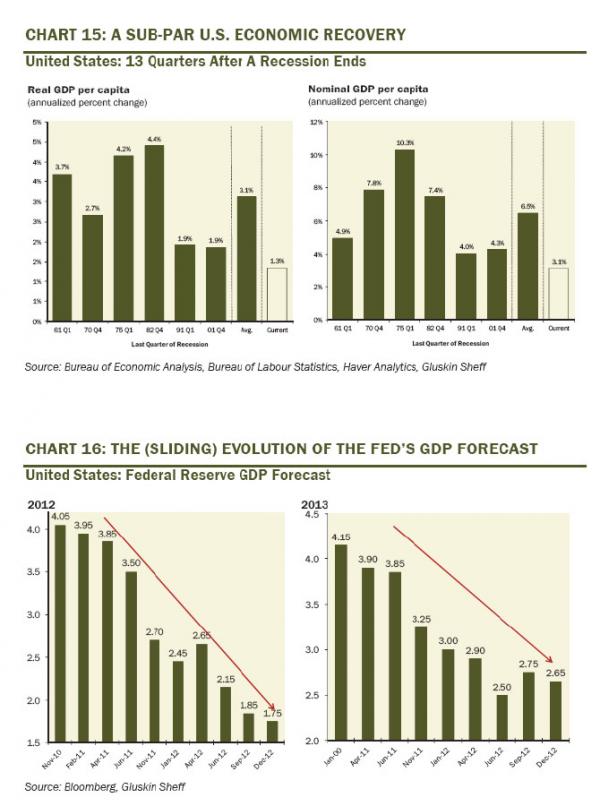
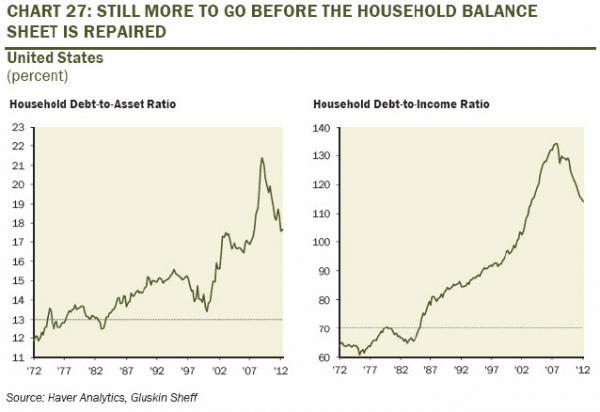
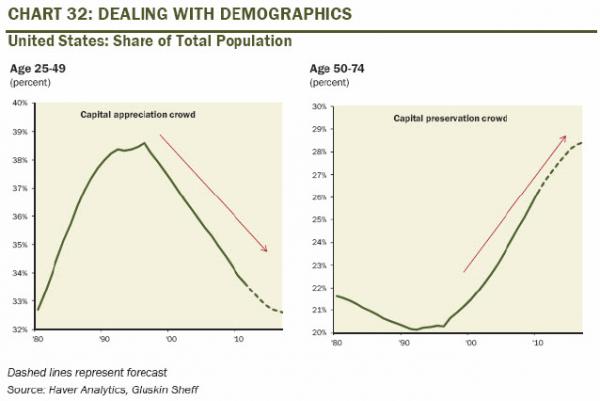
The Fed’s recent actions imply that it will permit inflation to temporarily rise above 2% in the hopes of reducing unemployment and spurring growth at a faster pace. While that occurrence remains to be seen, there is potential for even deeper negative real yields over the coming year to boost stocks further. However, as I’ve been arguing for many months, future earnings growth will likely be much weaker than expected and may turn negative. Last year I offered my own predictions for 2012. In the next couple weeks, I hope to discuss those successes and failures, while also putting forth new predictions for 2013. In the meantime, here are few charts from Rosenberg’s outlook that caught my eye:

Monday, December 3, 2012

Canada Catches the Deficit Reduction Bug

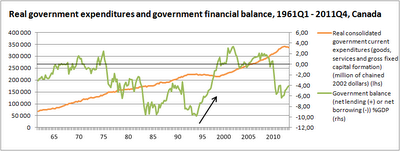
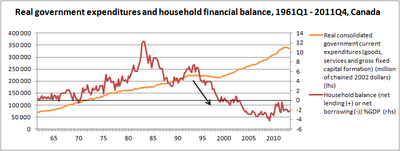
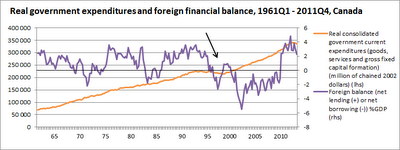
Over the course of this year, economic growth has been slowing considerably in many countries that were previously considered beacons of strength following the global financial crisis. Among those countries falling on harder times is Canada, eking out growth of 0.1 percent in the third quarter. Canada appears determined not to be outdone by Europe and Australia in reducing its budget deficit at the expense of economic growth. Canadian optimism based on the last round of austerity is badly misplaced for reasons outlined in this fantastic post on Austerity in Canada: Then and Now (at Fictional Reserve Barking). Taking a sectoral balances approach, here are three charts that highlight the differences:

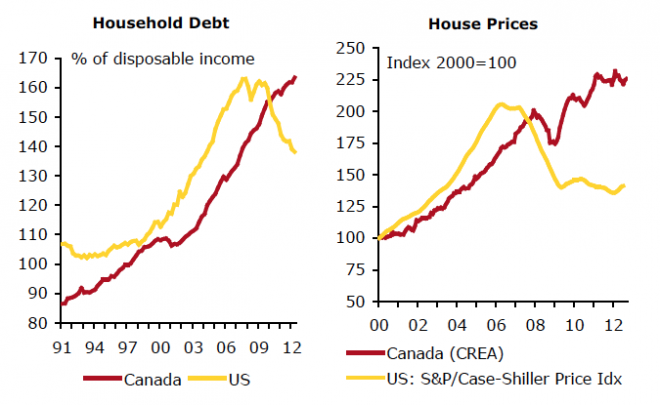
During the 1990’s, Canada witnessed a dramatic rise from a ten percent budget deficit to a fiscal surplus. That reduction in aggregate demand was countered by a significant decline in the household financial balance to a net borrowing position and a substantial trade surplus (foreign net borrowing). Keeping with global trends, the massive rise in Canadian household debt was primarily funneled into the domestic housing sector, pushing prices into bubble territory:
Source: Macleans.ca

The Canadian government’s hopes of repeating its “success” from over a decade ago will require a renewed surge in demand from one of the other sectors. Weak global growth, especially in China, suggests that commodity-rich Canada will not witness a dramatic reversal in their trade balance anytime soon. That leaves the household (or business) sector to pick up the slack.

As witnessed recently in the US and throughout Europe, there comes a point at which households can no longer credibly be expected to repay outstanding debts. Regardless of what event brings about this realization (possibly declining house prices), the ensuing household deleveraging will be a major headwind to growth.

A global commodity boom and domestic housing bubble bailed out the Canadian government last time it attempted to drastically reduce the budget deficit. This time around, the government’s actions may be enough to bust the housing bubble and push Canada into a recession.

Saturday, December 1, 2012

Bubbling Up...12/1/2012

1) China after the Global Minotaur by Yanis Varoufakis
In the book’s penultimate chapter, I discussed the Soaring Dragon which, as everyone tells us, is waiting in the wings, purportedly to take over from the Global Minotaur (click here for a pdf copy of that chapter). In my concluding remarks, written back in January 2011, I wrote: “To buy time, the Chinese government is stimulating its growing economy and keeps it shielded from currency revaluations, in the hope that vibrant growth can continue. But they see the omens. And they are not good. On the one hand, China’s consumption-to-GDP ratio is falling; a sure sign that the domestic market cannot generate enough demand for China’s gigantic factories. On the other hand, their fiscal injections are causing real estate bubbles. If these are unchecked, they may burst and thus cause a catastrophic domestic unwinding. But how do you deflate a bubble without choking off growth? That was the multi-trillion dollar question that Alan Greenspan failed to answer. It is not clear that the Chinese authorities can.”
In the eighteen months that followed since those lines were written, events have confirmed the projected pattern. The table below reveals that the falling rate of Chinese consumption is continuing unabated. In 2011 of every one dollar of income produced, only 29 cents entered China’s markets. With net exports making a small annual contribution to domestic demand (even though they contribute greatly to the country’s capacity to invest and, thus, boost productivity), the onus falls increasingly on investment to meet the demand shortfall. However, as suggested in the avove paragraph, this emphasis on investment is a double edged sword, as it threatens to let the Giny out of the bottle in real estate markets, where bubbles have been looming threateningly for a while now.
199019952000200520092011
Private Consumption494445403429
Investment354236424858
Government Consumption121317121110
Net Exports412673
Composition of Chinese Aggregate Demand (Percentages of Gross Domestic Product). Source: National Bureau of Statistics of China
Woj’s Thoughts - Most economists agree that China needs to re-balance its economy away from investment and towards private consumption. China has made very little progress, if any, in this regard. As for the potential housing bubble, opinions are far more divergent. After a recent trip to China, my wonderful professor, Garrett Jones, remarked that families were using second homes as a savings vehicle but faced difficulty in abruptly moving their larger, extended families living under the same roof. While I respect that view, the growth of private debt to purchase homes leads me to side with Yanis.

2) When the Credit Transmission Mechanism Breaks… by Cullen Roche @ Pragmatic Capitalism
If you look at the 30 year mortgage rate closely you’ll notice a relatively steady inverse correlation between rates and new home sales.  That is, all the way up until about 2007.  Then, rates remain low and new home sales stay depressed.  The low rate transmission mechanism breaks.
Why does it matter?  This is exactly what we’d expect to see given the state of the balance sheet recession.  You see, demand for credit is very low because households are still recovering from the implosion in their balance sheets.  Instead of taking on more debt, households are paring back debt.  This is clear from yesterday’s NY Fed report on household credit trends.  And this is why monetary policy has been so broken in recent years.  The Fed can’t gain traction because their primary transmission mechanism is busted.  And the economy won’t feel quite right until this part of the monetary system starts working normally again….

3) Death of a Prediction Market by Rajiv Sethi
A couple of days ago Intrade announced that it was closing its doors to US residents in response to "legal and regulatory pressures." American traders are required to close out their positions by December 23rd, and withdraw all remaining funds by the 31st. Liquidity has dried up and spreads have widened considerably since the announcement. There have even been sharp price movements in some markets with no significant news, reflecting a skewed geographic distribution of beliefs regarding the likelihood of certain events.
It seems to me that the energies of regulators would be better directed elsewhere, at real and significant threats to financial stability, instead of being targeted at a small scale exchange which has become culturally significant and serves an educational purpose. The CFTC action just reinforces the perception that financial sector enforcement in the United States is a random, arbitrary process and that regulators keep on missing the wood for the trees.

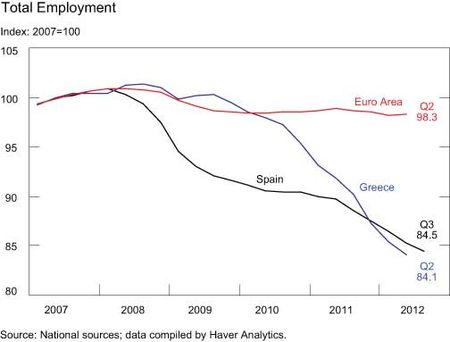
4) The Different Paths of Greece and Spain to High Unemployment by Thomas Klitgaard and AyÅŸegül Åžahin @ Liberty Street Economics 


The high unemployment rate in Greece is not surprising given the depths of its recession, but what explains Spain’s 25.8 percent unemployment rate given its much more modest downturn? One contributing factor is the fact that the composition of Spanish jobs made the economy vulnerable to dramatic job losses during a recession. In 2007, almost 13 percent of jobs in Spain were in construction, compared with roughly 8 percent in Greece and the euro area. Such a heavy weight on this sector made employment more vulnerable to a downturn given the fact that construction is the sector that typically experiences the steepest decline in a recession. Indeed, construction, as measured in the GDP accounts, fell 35 percent from 2007 to 2011, and the sector accounted for almost 60 percent of the decline in total employment over this period.
   Another contributing factor is the very high percentage of employees tied to temporary work contracts in Spain. Data from the Organisation for Economic Co-operation and Development show that 32 percent of employees in Spain worked under temporary contracts and 68 percent under permanent contracts in 2007. In Greece, 10 percent were on temporary contracts; the figure for Europe as a whole was 15 percent.
Woj’s Thoughts - Both countries suffer from excessive private debt that is being transferred to the public sector as the private sector attempts to deleverage. Considering the size of the housing bubble in Spain (the bust continues), the relatively large portion of jobs in construction before the crisis and decline in employment within that sector afterwards are no surprise. However, the percentage of temporary workers in Spain is striking (Does anyone know if this is tied to cultural or policy reasons?). As both countries attempt to move towards balance budgets, the downward trend in unemployment and GDP is likely to continue.

Friday, August 31, 2012

1st Day of Micro - Households and Governments are NOT the Same

Classes began this week and for what its worth, I have successfully completed my first week of class as a PhD student in economics. My choice of school, George Mason University, was primarily due to the desire to join the mainline of economics, not the mainstream (see Living Economics: Yesterday, Today, and Tomorrow by Peter J. Boettke for details on the difference).

Although I am excited about the opportunity, one area of economics where I feel my incoming views might contradict those of professors’ is related to modern money regimes. An example of this distinction is the contrasting beliefs that governments with fiat currencies, who sell debt in their own currency, cannot become insolvent versus the seemingly widespread belief that the US government will default if drastic actions to cut deficits/spending are not promptly taken. You can imagine my joy/relief, when during my first microeconomics class, Walter Williams used the following example to demonstrate the fallacy of analogy (approximate quote):

If a household has expenditures greater than their income they’ll go bankrupt, therefore if governments have expenditures greater than their income, the government will go bankrupt. Well, the latter is not necessarily true. Why? Because governments can always pay their debt, can’t they? They’ll just print money.
While I can’t/won’t claim that all GMU econ professors, Austrians, or Libertarians recognize this distinction (I’m not even sure which of the latter two, if either, Williams’ associates with) , I imagine the percentage that do is higher than many critics believe. For my part, I’m excited about the potential for further intersections between my classes and readings on modern money.

(Note: Unfortunately, for those who enjoy this blog, my priorities are shifting to the PhD program for the foreseeable future. I will try to update the blog as much as possible, but in doing so, will probably focus more posts on class readings, topics and discussions. Thank you to all my readers for support and to commenters for helping further my education.)