Showing posts with label Saving. Show all posts

Wednesday, February 6, 2013

Inequality Really Is Holding Back the Recovery

A couple weeks ago Nobel Laureate Joseph Stiglitz generated a heated debate among economists by claiming “Inequality Is Holding Back the Recovery.” Paul Krugman, another Nobel Laureate who is normally on Stiglitz’s side in these debates, actually took a somewhat opposing position:
First, Joe offers a version of the “underconsumption” hypothesis, basically that the rich spend too little of their income. This hypothesis has a long history — but it also has well-known theoretical and empirical problems.
It’s true that at any given point in time the rich have much higher savings rates than the poor. Since Milton Friedman, however, we’ve know that this fact is to an important degree a sort of statistical illusion. Consumer spending tends to reflect expected income over an extended period. If you take a sample of people with high incomes, you will disproportionally include people who are having an especially good year, and will therefore be saving a lot; correspondingly, a sample of people with low incomes will include many having a particularly bad year, and hence living off savings. So the cross-sectional evidence on saving doesn’t tell you that a sustained higher concentration of incomes at the top will lead to higher savings; it really tells you nothing at all about what will happen.
So you turn to the data. We all know that personal saving dropped as inequality rose; but maybe the rich were in effect having corporations save on their behalf. So look at overall private saving as a share of GDP:
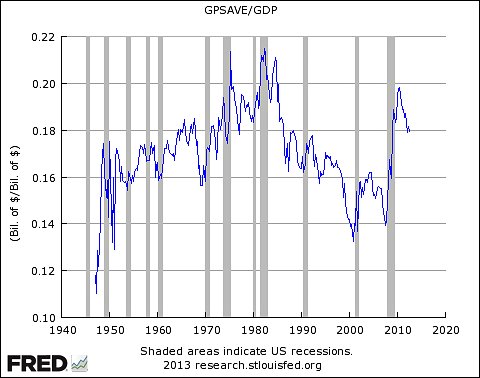
The trend before the crisis was down, not up — and that surge with the crisis clearly wasn’t driven by a surge in inequality.
Not convinced by Krugman’s analysis, Arthur Shipman considers other potential reasons that gross saving might have fallen in response to rising inequality. As he wisely points out, the above trend is reminiscent of the change in inflation rates:
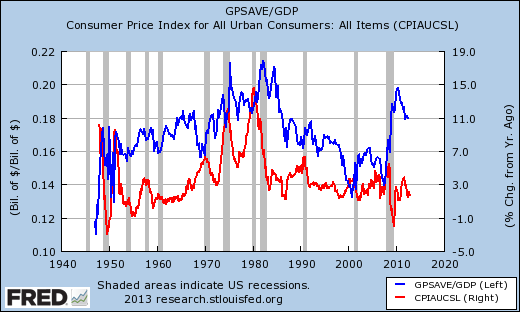
and even more so, the pattern of interest rates:
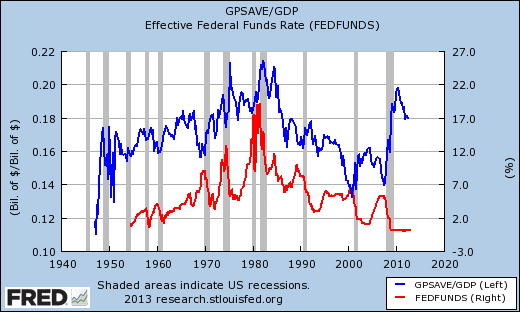
Still unsatisfied, Arthur concludes:
So are there a lot of explanations for why Krugman's graph goes up and down?
There must be.

While I won’t disagree with Arthur’s conclusion, I think a potentially satisfying explanation does exist if one disaggregates gross private saving.

Gross private saving = personal saving + wage accruals less disbursements + consumption of fixed capital (domestic business + households and institutions) + undistributed corporate profits with inventory valuation and capital consumption adjustments.

Using interactive data from the Bureau of Economic Analysis, Krugman’s chart can be recreated to depict each of the disaggregated measures as a percentage of GDP:
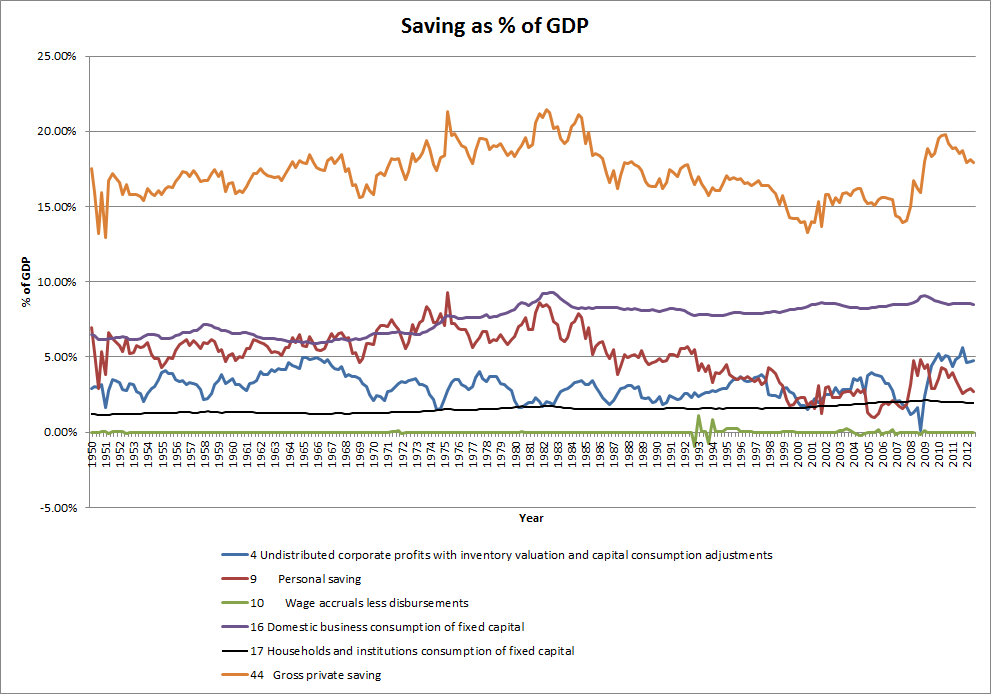
This chart makes it patently obvious that the sharp swings in gross private saving, as a percentage of GDP, are almost entirely due to changes in personal saving and undistributed corporate profits with inventory valuation and capital consumption adjustments.

Specifically focusing attention on the period from the mid-1980’s up to the recent crisis, the entire decline in gross private saving is basically due to declining personal saving. Can this observation be reconciled with rising inequality during the same time period?

In my view, the staggering fall in personal saving can not only be reconciled with rising inequality but also with declining inflation and interest rates. Rising income and wealth inequality starting in the 1980’s meant that many households could no longer maintain relative levels of consumption based solely on disposable income. Assuming this trend would not persist indefinitely, or maybe just unwilling to lower relative consumption, a proportion of households either drew upon previous savings or sought out loans (new debt) to temporarily raise consumption. As the upward trend in inequality persisted, more households elected to reduce savings or, having exhausted their savings, increase demand for debt.
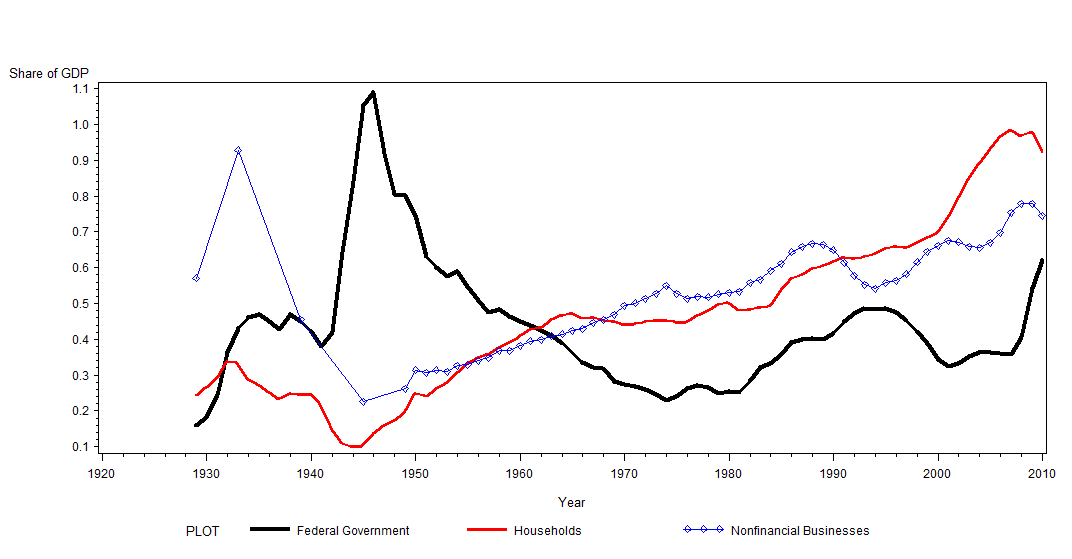
Coincidently, inflation and interest rates were steadily declining during these years. Combined with numerous new debt subsidies and implicitly increasing federal backing, banks were all too eager to meet the rising demand for credit. This explosive expansion of credit is readily apparent in the following chart of household debt to GDP:
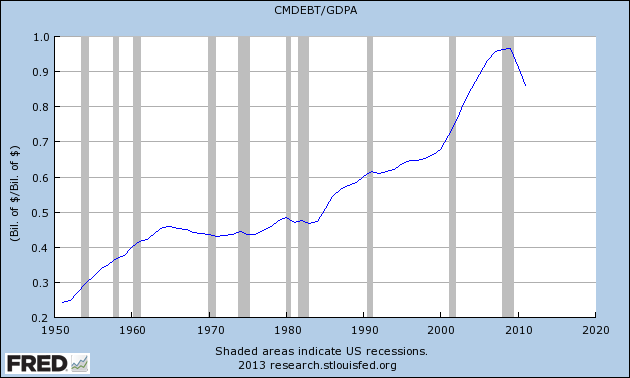


The concurrent drawing down of savings and growing stock of outstanding debt among households provides a very straightforward explanation for how inequality drove the observed decline in personal saving.

Returning to the disaggregated chart of saving as a percentage of GDP, the reasons behind the sharp rise during and after the recent crisis are also much clearer. On the household side, declining home values and rising unemployment clearly brought about a shift in personal saving. Having already amassed a large stock of debt, households were pressured to increase saving in order to meet the principal and interest payments coming due. Furthermore, recognition by many households that previous saving was insufficient for present retirement plans may have added to the rise in personal saving.

Switching to the corporate side, the change in undistributed corporate profits can also be disaggregated into its distinct parts:
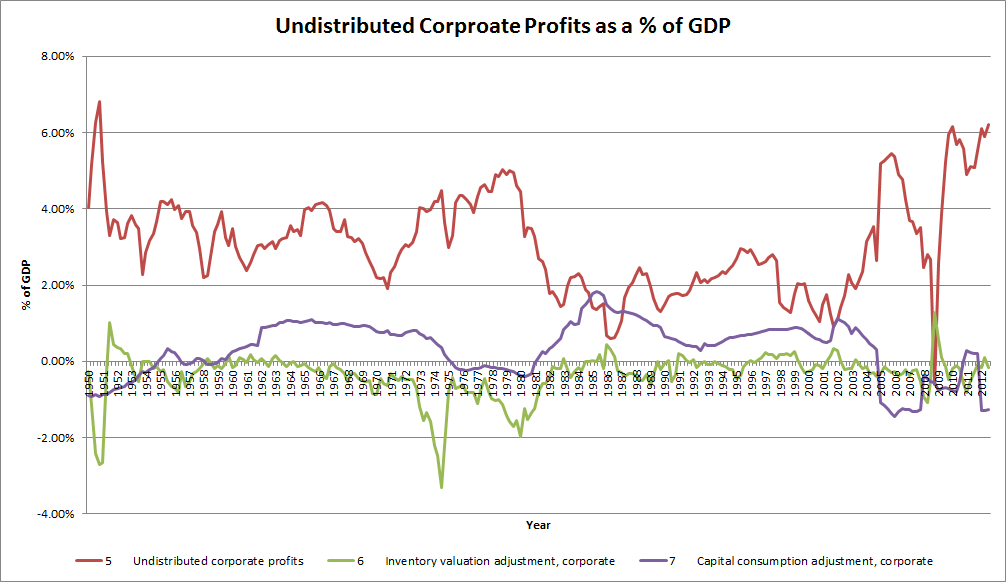
The recent crisis saw an unparalleled fall and rise in undistributed corporate profits that returned the percentage to heights previously witnessed only briefly sixty years ago. It’s also worth noting that undistributed corporate profits had risen significantly following the bursting of the dot-com bubble. Contrary to Krugman’s claim, this suggests wealthy households were and are continuing to use corporations as a means of effective saving.  

By disaggregating the data for gross private savings, the drivers behind the large fluctuations and trends become increasingly apparent. This data is consistent with rising income and wealth inequality but requires reversing Stiglitz’s “underconsumption” hypothesis. Trying to maintain relative consumption levels, many households clearly chose to rely on previous savings or new debt as a means of temporarily boosting consumption. As inequality continues to rise, wealthy households are now electing to retain more of their savings within corporations. It doesn’t take a leap of faith to suggest this combination of factors depresses aggregate demand. Stiglitz is therefore correct in concluding:
Now we realize that we are paying a high price for our inequality and that alleviating it and promoting growth are intertwined, complementary goals. It will be up to all of us — our leaders included — to muster the courage and foresight to finally treat this beleaguering malady.

Wednesday, July 18, 2012

Debt Surges Don't Cause Recessions...Excessive Aggregate Amounts Do

In a post titled Debt Surges don’t cause recessions, Scott Sumner, questions the following argument from Paul Krugman:
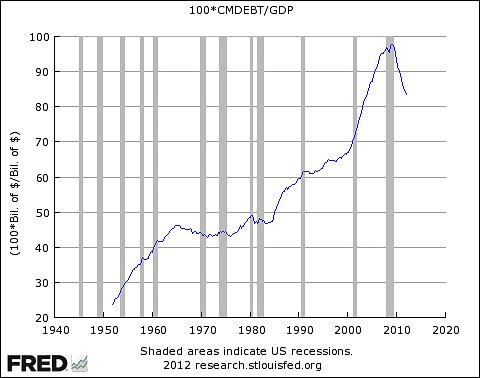
Second, a dramatic rise in household debt, which many of us now believe lies at the heart of our continuing depression. Here’s household debt as a percentage of GDP


Sumner says:

What do you see?  I suppose it’s in the eye of the beholder, but I see three big debt surges:  1952-64, 1984-91, and 2000-08.  The first debt surge was followed by a golden age in American history; the boom of 1965-73.  The second debt surge was followed by another golden age, the boom of 1991-2007.  And the third was followed by a severe recession.  What was different with the third case?
The difference is the aggregate amount of household debt compared with incomes (GDP). The use of credit (debt) instead of money (income + savings) has an extra cost associated with the interest payments. As the aggregate amount of debt rises, aggregate interest costs follow. To simply stem the rise in debt, let alone maintain the current level, an increasing percentage of income and savings becomes necessary to cover interest costs and/or pay back previous debt. These actions reduce the amount of income and savings available for consumption and investment, creating a drag on economic growth.

Since households are no longer in a position to drive growth, other sectors must pick up the slack to prevent incomes from stagnating or falling. If incomes struggle, many households will have to shift an even larger percentage of income to paying interest and debt, while others simply become unable to repay the full amount. This deleveraging worsens the contraction from the household sector and leads to losses within the corporate and financial sector. If those sectors are equally leveraged with debt (as was the case in the US) then the losses in income and capital may cause those sectors to reduce spending and lending, respectively. This process can ultimately generate a vicious cycle where attempts to deleverage by each group reduces the income of others and subsequently increases the burden of debt. Absent growth in income from either the public or external sectors, this cycle will eventually slow but at a much lower level of GDP.

Update: The Arthurian continues to dissect the Monetarist disregard of rising household debt levels:

During the famous flat spot of 1965-1983, the comparable rate of debt growth was 9.36%. That's near 90% of the growth rate for the 1952-1964 "debt surge" and it is higher than the growth rate for the third debt surge Sumner identifies.
There was no remission. Debt did not stop growing. It barely slowed.
Prices increased at a compound annual growth rate of 6.6% per year between 1965 and 1983, more than tripling during those years. There was no remission of debt. There was only erosion of debt because of the inflation.

Friday, May 25, 2012

Investing Lessons For My Fellow Generation Y


That is why it is so important that Gen Y investors take advantage of the opportunity to invest, especially in tax-advantaged accounts like 401(k) and IRAs, early on in their careers. When the tax laws are working with you, the odds are put in your favor no matter where you decide to invest. The traditional argument for saving early (and often) in one's adult life is compound interest. Which is of course is true. That being said it is unlikely that Albert Einstein ever said compound interest was "the most powerful force in the universe."
In my book, Abnormal Returns: Winning Strategies from the Frontlines of the Investment Blogosophere, I write that "savings is the best investment." By that I mean that it is far easier to generate additional savings through more conscious consumption than it is to generate additional returns, or alpha, from the financial markets. So starting early with a dedicated plan to live below your means is an important part of any comprehensive financial plan.
More importantly as a young investor you get a chance to make your novice investment mistakes while the stakes are, in actual dollar terms, relatively low. Or as said in a different context, "You only get one chance to be a beginner." Wouldn't you rather experience your first bear market when you are 25 and you have $5,000 in your 401(k) plan than when you are 50 and retirement is beginning to stare you in the face? The experience gained when you are young will help you when the stakes are ratcheted up later on in your career.
Read it at The Reformed Broker
Compound Experience, Not Just Interest
By Tadas Viskanta of Abnormal Returns

My interest and excitement for the financial markets began at the early age of 13 when my grandparents gifted stocks (Coke and Disney) as a Bar Mitzvah present. During high school, in the midst of the dot-com bubble, I learned about the stock market and practiced investing online with fake money portfolios. When that bubble burst, I felt fortunate to not have been trading with real money.

After turning 18, having saved up a bit of money, I opened a 401(k) and decided to try my hand at real investing. During college I invested on my own account and continued adding money to my 401(k). Over the summers I enjoyed internships at a day-trading firm, hedge fund and with financial advisors. Following college I took a full-time job as a trader at an options market-making firm. Little did I know that the housing bubble had already gone bust and the stock market was nearing its peak. With real money now on the line, the following 60% drop in stock markets was painful to witness.

Markets have now recovered most of the losses from that second bubble of the decade, but remain at levels first seen 13 years ago. Although I don’t know how the future will play out, I personally am very grateful that my first two bear markets occurred before I turned 25 and had significant money on the line. The experiences have already made an enormous impact, not only on my investing strategy, but also on my career.

For my fellow Gen Y investors, I fully recommend taking the above advice from Tadas to heart. Start early with plans to conserve your consumption and open a 401(k) (You can take money out of the 401(k) without any penalty to use as a down payment on your first home). Only invest a limited amount, at first, until you become aware of how you will respond in a bear market (if you want or need to sell after steep losses you are taking too much risk). Lastly, do not use any leverage until you’ve gained significant experience since it will likely compound losses from your mistakes.

In my opinion stock markets are still not out of the woods from this secular bear market. That means at least one more cyclical bear market before the next secular bull market begins. Hopefully other Gen Yers will take advantage of this opportunity and these lessons to ensure we’re prepared well in advance of the day when retirement comes.

Saturday, March 24, 2012

Points of Public Interest

Ugly day in DC after a beautiful week, but more good NCAA basketball on TV. Good luck to those whose brackets still have a chance of winning!

  1. “The Current Models Have Nothing to Say”
Should we be surprised? Policy makers continue to employ models of an economy with no financial system.
  1. Economics without a blind-spot on debt
The aggregate level of debt, especially private, matters in
forecasting economic growth.
  1. Consumer Credit Growing at Highest Rate in Past Decade: Unhealthy and Unsustainable?
Stopping addictive habits is not easy, but extending those actions will only make the eventual adjustment more difficult and painful.
  1. The Japan debt disaster and China’s (non)rebalancing
Chinese consumers continue to increase savings in lieu of domestic consumption. Japan is attempting to rebuild its trade surplus, but which countries will allow their surplus to decline or deficit to increase? Global (and domestic) imbalances not addressed remain significant risks to the global economic outlook.
  1. A step in the right direction
Scientific exploration incorporating complex systems and networks continues to move our understanding of reality forward.
  1. It's not structural unemployment, it's the corporate saving glut
Businesses save instead of investing in labor when consumer demand is weak. Until policy focuses on improving the consumer balance sheet (e.g. debt write-downs), unemployment will remain high.
  1. Wrong vs Early – Contrarians Bet on Natural Gas
The best investors are often early and patient.
  1. The Real Problem with Microfoundations
Microeconomics is not especially sound in predicting all outcomes
either.
  1. Principal writedowns of the day, mortgage edition
Positive for households but will Bank of America (and others) really accept the associated losses?
  1. Why Using P/E Ratios Can Be Misleading
In early 2009, at the market bottom, the P/E jumped to over 100 as profits plummeted. Using E/P corrects for this issue and shows the market is slightly overvalued currently.
 

Wednesday, March 7, 2012

Saving is NOT Enough for Consumer Led Recovery

Over the past few years, public policy has relentlessly attempted to ensure the solvency and profitability of the financial sector, namely the largest financial institutions. Lost in these efforts is any recognition that the Great Recession was primarily due to a highly indebted household sector being pressured to reduce leverage. As shown in the graph below (from Fisher Dynamics in Household Debt: The Case of the United States, 1929-2011), household debt as a percentage of GDP increased from approximately 10% in 1945 to nearly 100% by 2007.
As an avid follower of new economic work being done in Post-Keynesianism, Modern Monetary Theory (MMT) and Modern Monetary Realism (MMR), I’ve often been perplexed by apparent inconsistencies in discussions regarding saving and leverage. My confusion stemmed, in part, from the notion that households are capable of saving and increasing leverage (debt as a share of GDP) at the same time. If you’re a bit confused at this point, don’t worry, I’ll explain the situation more simply in a moment.

Before moving on, it’s important to recognize that economic terminology often does not fit with typical usage of every day words. Here are some important economic terms to understand going forward:
Saving -  The difference between disposable income and consumption.
Disposable Income - Income minus taxes.
Consumption - The amount spent on non-durable goods (e.g. food, clothing) plus the amount spent on durable goods (e.g. autos) spread over the item’s life span. (Note: Purchasing a home is an investment, for which an imputed rent is counted as consumption.)

Using this definition of saving, it becomes clear that households can maintain a positive savings rate yet still be net borrowers, as long as that borrowing goes towards investments. Ramanan, a horizontalist, recently explained this concept in a wonderful post on Saving Net Of Investment [Updated]. From this perspective, the frequent comment that households must increase saving to reduce leverage is clearly false. The rise in household debt during the post-WWII period is apparently based on net borrowings, not the private savings rate.

This new found understanding has proved short-lived after reading the following Guest Post by JW Mason: The Dynamics of Household Debt over at Rortybomb. A new working paper finds

“that changes in borrowing behavior has played a smaller role in the growth of household leverage than is widely believed. Rather, most of the increase can be explained in terms of “Fisher dynamics” — the mechanical result of higher interest rates and lower inflation after 1980.”
Put in simpler terms, interest rates on household debt since 1980 have been consistently higher than income growth. Under these conditions, even without increasing borrowing, household leverage will increase.

Over the past few years, household leverage has been decreasing largely due to debt write-downs. With this process slowing, the scenario mentioned above is likely to return. Even though interest rates remain at or near historical lows, income growth has been practically stagnant. Without a drastic change in these variables, the large burden of household debt is likely to continue suppressing consumer demand well in to the future. Attempts by households to increase saving may inadvertently decrease income, exaggerating the problem. Simply put, significant debt write-downs (a modern day debt-jubilee) may be necessary to restore the household sector to a stronger, more stable, financial position.    

Sunday, February 19, 2012

Quote of the Week

...is from Of the Influence of Consumption on Production by John Stuart Mill (h/t Russ Roberts of Cafe Hayek):
II.4
In opposition to these palpable absurdities, it was triumphantly established by political economists, that consumption never needs encouragement. All which is produced is already consumed, either for the purpose of reproduction or of enjoyment. The person who saves his income is no less a consumer than he who spends it: he consumes it in a different way; it supplies food and clothing to be consumed, tools and materials to be used, by productive labourers. Consumption, therefore, already takes place to the greatest extent which the amount of production admits of; but, of the two kinds of consumption, reproductive and unproductive, the former alone adds to the national wealth, the latter impairs it. What is consumed for mere enjoyment, is gone; what is consumed for reproduction, leaves commodities of equal value, commonly with the addition of a profit. The usual effect of the attempts of government to encourage consumption, is merely to prevent saving; that is, to promote unproductive consumption at the expense of reproductive, and diminish the national wealth by the very means which were intended to increase it.
II.5
What a country wants to make it richer, is never consumption, but production.

Nearly 200 years ago, Mill recognized the faulty logic in trying to stimulate wealth by encouraging individuals to increase consumption. Sadly this lesson remains unlearned, as far too many public policies today are directed at subsidizing consumption (ie. autos, houses, oil). What is worse, a great deal of discussion regarding this topic blatantly ignores that two types of consumption even exist. Partially due to this omission, incentives to consume are often directed towards the unproductive type.

At an early age I was taught the virtues of saving and the potential benefit of compound interest. It strikes me as odd that this lesson, generally taught to children, is reversed for adults on the macro scale. Holding large amounts of outstanding debt (auto loans, mortgages, student loans, credit cards) has seemingly become the norm and an expected outcome for many individuals. Compound interest works against the borrower, raising the level of outstanding debt and reducing chances of ever paying down principal balances. (This appears to be precisely how the private sector can maintain a positive savings rate while the ratio of private debt to GDP continually increases.)

The Great Recession was largely influenced by a massive accumulation of private/household debt that could not be repaid or refinanced when assets values, most notably homes, turned lower. Increasing the nation’s wealth, for more than a couple years, will not be attained by stimulating unproductive consumption. Policy discussion must now shift to encouraging a healthy level of saving and greater focus on reproductive consumption.   

Sunday, January 15, 2012

Points of Public Interest

  1. Fundamental and Mathematical Case for Structurally High Unemployment for a Decade - Mish Shedlock exposes the declining labor force, despite population growth, as the main reason for the falling unemployment rate.
  2. Bubbles and Beauty Contests – To What Extent is Keynes Relevant to Investors? - Philip Pilkington uses one of Keynes’ best passages from the General Theory to show how most investors’ fool themselves into poor decisions.
  3. Why I’m feeling strangely Austrian - Gideon Rachman sheds light on some emerging trends in political/economic ideology (rightwing populist, social democratic-Keynesian, libertarian-Hayekian and anti-capitalist/socialist).
  4.  A slightly off-center perspective on monetary problems. Saving isn’t “setting money aside,” it’s BUILDING CAPITAL GOODS - Scott Sumner deals with some misconceptions about the actual meaning of saving as it relates to economics and economic statistics.
  5. European Identities Part II - Francis Fukuyama describes the real EU crisis as a lack of European identity. The relationship between people living in Kentucky and New York is far different than that of Greeks and Germans. He mentions the rise of populist governments as something troublesome to watch for in the years ahead.