Tuesday, December 28, 2010

Making Sense of Projections

   As 2011 approaches, it's important to look back at the year passing. Entering 2010, analysts and experts were largely bullish on the economy and stocks. Many prognosticators expected U.S. GDP growth above 3.5%, unemployment to fall towards 9%, 10-year Treasury yields to rise above 4% and the S&P 500 to climb above 1250. Oddly enough, while the consensus was nearly dead on regarding the stock market, most other expectations for the economy proved off target. Given this divergence, considering which expectations are or aren't important for maintaining predictions on the stock market would appear to be valuable insight.
 
   Determining the pace of economic growth for future years intuitively seems like an important factor in estimating earnings growth. (S&P 500 earnings used as metric) This intuition happens to be very misleading looking back over the past 50 years. Amazingly, since 1960 there have only been 5 years during which real GDP growth was negative over the entire year. However, during the same period, there have been 12 different years in which S&P 500 earnings declined. Of those 5 years that real GDP declined, 2008 marked only the third in which both real GDP and earnings dropped together. Also surprising, real GDP actually grew above 4% in three separate years that earnings declined. Glancing at the other 75% of the years when earnings actually grew, the level of GDP expansion shows very little correlation. GDP growth expectations may be rising toward 4%, but whether higher earnings will follow remains unclear.
 
   With new tax cuts recently enacted and further rounds of quantitative easing (both opposites of last year's expectations), an expanding GDP is believed to start bringing down unemployment in 2011. Although pundits have predicted monthly job growth topping 250,000 since the fourth quarter of 2009 to no avail, those predictions remain widespread for 2011. As 2010 comes to a close, unemployment remains elevated near 10%. Making matters worse (in real terms, better by numbers), nearly 8 million Americans have dropped out of the workforce in the past 3 years. By comparison, when unemployment last topped 10% between 1981 and 1982, the peak to trough loss in total workforce was only 2 million. This period also began a string of negative earnings growth in 4 out of 5 years. So far, heightened unemployment has created far less damage to corporate earnings this time around. Whether this new trend holds will be interesting to watch since workforce growth alone makes hopes for 5 % unemployment daunting. 
 
   A strengthening economy was believed to generate confidence in the recovery and push investors into riskier assets in 2010. As a byproduct, Treasury yields were expected to rise with the Federal Reserve beginning to raise interest rates in the fourth quarter of the year. 10-year Treasury yields began the year above 3.8% and after briefly topping 4%, plunged below 2.35% before finishing the year around 3.4%. Rather than gaining confidence in the recovery, the Fed has actually cut economic forecasts throughout the year and embarked on a second round of quantitative easing. Although rising rates are a negative for equity valuations, yields are once again expected to rise in 2011. Yields have primarily been falling for 30 years, accompanying massive growth in earnings and stocks. If the trend reverses in coming years, this correlation may prove troublesome for bond and stock investors alike.
 
   Heading into 2010, S&P 500 earnings were expected to increase nearly 30% to approximately $83. Despite weaker GDP growth and higher unemployment, 2010 earnings are now likely to top expectations, totaling more than $85. With that year end total, 2010 will mark the second largest increase in earnings since 1960 (when earnings were only $3.11). 2011 is thought to be another banner year for earnings, growing 14% to a new all-time high over $97. Alongside rising earnings, the S&P 500 is widely projected to increase between 10-20% next year. It's worthwhile to consider that only once since 1960 has the S&P 500 experienced double digit gains in 3 or more consecutive years (five straight from '95-'99). This amazing string was followed by the only 3 year period of recurring losses since 1960 (each year was down double digits). While the current outlook seems extremely bright, past precedent argues for caution in becoming too bullish.
 
  As analysts, investors, economists and others share their outlooks for 2011, I urge investors to apply a couple lessons from history. First and foremost, predictions are frequently incorrect and which projections prove true is anybodies guess. Second, economic growth and unemployment may be less associated with corporate earnings or stock market performance than previously thought. Therefore, variations in economic projections or failure to accurately predict economic growth may not imply incorrect market expectations. Third, be conscious of historical trends, which may not help forecast the future but offer insight for judging projections.  
 
 
mm1
 
   For the past 6 years, strategists have predicted the S&P 500 would end the years with gains (shown above). Their predictions have proved correct 83% of the time. Unfortunately, the one year projections were wrong, the index lost nearly 40%. The S&P 500 closed 2004 at 1211.92 and today rests a few percent higher at 1257. Even more frustrating to investors, the S&P 500 closed 1998 at 1229.23. Despite rising in 10 out of 12 years, the stock market has barely moved. Predicting the stock market to rise is clearly a matter of odds. Earning returns over the long-run may prove a bit more difficult. 
   
   With only a few days left in 2010, here's to hoping the optimistic outlook for 2011 proves true.   

Friday, December 24, 2010

The Bubble that Wasn't

   An economic bubble is often described as "trade in high volumes at prices that are considerably at variance with intrinsic values (Wikipedia).
   Some analysts claim that the commodities market is in the middle of another bubble, as the prices of crude oil, copper, wheat and coffee reach multi-decade highs while these products attract record financial investments. Tobias Levkovich, Citigroup’s chief US strategist, holds this view. He says in a recent report that commodities, particularly gold, are looking like a “bubble prospect” as “easy money and speculative juices combine to drive prices unsustainably higher”. But whether commodities have truly become the third and last bubble of the past decade is open to debate. Kevin Norrish, at Barclays Capital, disagrees with the view of a bubble. “The price rise is fundamentally driven,” he says, pointing to robust demand, lagging supply in spite of record prices for key raw materials, and jumping production costs. John Kemp, an economist at Sempra Metals, a London-based commodities brokerage, says a bubble has probably emerged as investors pile into raw materials on the expectation that prices will continue to rise. “It will be a mistake to assume that commodities prices will rise further without doing damage to the economy and triggering a response from central banks worried about inflation,” Mr Kemp says.
   The above passage actually comes from an article by Javier Blas in the Financial Times on March 10, 2008 titled Analysts differ about commodity bubble. In reality, the only thing mentioned above that has really changed in the last two and half years is that few analysts currently believe commodities represent a bubble. For most individuals, aside from changes in the price of crude oil which are overly apparent in the rapid price changes of gasoline, the price of most commodities probably goes unnoticed. Therefore one could be forgiven for not recognizing the remarkable price swings that have taken place over the past several years. In order to paint a clearer picture of the true magnitude of these fluctuations, let's look back at the price of several commodities over the previous decades.
   For a general representation of commodities, I've selected those mentioned in the above article (crude oil, copper, wheat, coffee) while adding silver and sugar to round out the group. Prices of various commodities are generally represented by futures contracts with the front month (nearest to current date trading) establishing the spot price for trading. The time series in consideration looks at the front month futures' closing price at the end of each month starting in January 1980 (except crude oil which begins in March 1983 and copper in December 1988). The graphs (courtesy of Bloomberg) shown below depict weekly closing prices of these front month contracts for the past 10 years.

Crude Oil
   In the early 1980's crude oil spiked due to foreign tensions and threats of cutting off supply. However, by 1983 the tensions had subsided and crude oil sat at $29.29 a barrel. Despite substantial economic growth during the rest of the 1980's, the price of crude oil actually fell to $21.82 by the end of the decade. The 1990's followed, marking one of the strongest decades of economic growth for the U.S. Yet for most of the decade crude oil prices held steady, until a 25% increase in the final 6 months pushed crude up to $25.6. As the new millennium began, the dot com bubble was well under way and the general consensus was that the Internet would dramatically expand worldwide economic growth. In 2000 the price of crude oil rose to nearly $34 before the first bubble of the decade popped and the ensuing recession sent prices back down under $20 by the start of 2002. It wasn't until early 2004 that crude oil topped $34 again and although it wasn't clear then, a massive run-up had begun. In the next 9 months, the price of crude would rise over 50% to nearly $52 a barrel. Another 10 months passed and the price reached almost $69. The price then staggered over the following two years, closing the first half of 2007 just above $70. This period later proved to be the calm before the storm as crude oil prices erupted in the following year, reaching a peak near $150 a barrel in July 2008. Crude oil prices peaked just as the subprime mortgage crisis was taking hold and most of the world was entering or already in a recession. Even more remarkable than the over 700% rise in 5 years was the dramatic decline that would follow. Within 5 months after reaching its peak, crude oil prices would fall to a low of $32 a barrel in December 2008. At the time, many economists and analysts considered the astonishing rise to have been a bubble, unsupported by fundamental demand/supply constraints and subject to significant speculation. While that premise seemed obvious at the time, 2009 brought about another rapid rise in prices to nearly $80 a barrel by year end. Although the upward momentum has slowed during 2010, crude oil seems poised to close above $90 a barrel this year. Looking ahead, most analysts expect a continuing trend with price predictions ranging between $100 and $120 a barrel for 2011. 

Copper
   Back in 1988, copper swapped hands for $1.56 per pound. By 1990, copper prices had fallen by over 50% to just below $1. The 1990's were not much better for copper as prices dropped another 15% to $0.85. After closing below $0.70 per pound at the end of 2002, China's rapid expansion sparked massive real and perceived growth in demand. Over the next 3 1/2 years, prices rose more than five fold to above $4 per pound by early 2006. The following two years witnessed some volatility with the price falling below $2.50 before topping out slightly above $4 again in early 2008. The ensuing decline rivaled the fall in crude oil as copper prices plunged below $1.25 per pound by the end of 2008. Although the drop failed to match similar extremes, the recent rise has actually exceeded that of crude oil. In 2009 copper nearly tripled, ending the year above $3.30 per pound. Helped by a greater than 10% rise in the past month, copper prices reached a new all-time high this week above $4.28 per pound.    

Wheat
   Wheat began the 1980's trading around $4.70 per bushel but fell to just over $4 by the end of the decade. The 1990's proved even worse for wheat with prices falling nearly 40% below $2.50 per bushel. Unlike oil and copper, wheat actually rose early in the new millennium climbing to $3.25 by the end of 2002. However, by 2006 little had changed with wheat trading just below $3.40per pound. Wheat joined the general commodity trend of astonishing growth a bit late but made up for it quickly. In slightly over 2 years wheat prices nearly quadrupled, eclipsing $13.30 per pound on the last day of February 2008. This massive rise was equally short-lived as prices declined below $5 per pound before year's end. Comparatively, the 50% increase in wheat over the past two years appears slim, but recent shortages suggest wheat may play catch-up in the near future.   
  
Coffee
    Similar to several other commodities, the 1980's were negative for coffee prices. During the decade, coffee fell more than 50% from over $1.60 per pound to just below $0.80 by the start of the 1990's. The 90's was a particularly volatile decade for the coffee market as prices fell near $0.50 towards the end of 1992, rallied above $2 late in 1994, fell back below $1 in 1995, spiked above $2.75 briefly in 1997 and ultimately settled around $1.25 per pound entering the new millennium. The new decade began similarly to the previous one as prices fell dramatically to just above $0.40 per pound near the end of 2001. Volatility would decrease and prices began rising steadily, peaking above $1.60 per pound in early 2008.  Differing from many other commodities, coffee prices were not as deeply affected by the credit crisis with prices remaining above $1 throughout the recession. As the world economy regained its footing and began expanding more rapidly, coffee regained its upward momentum. Over the past 6 months, coffee prices shot upwards from $1.35 to over $2.35 per pound and are quickly approaching new all-time highs. 
Silver
   Silver prices began the 1980's in a much different place than other commodities, near all-time highs above $35 per ounce. This peak was short-lived as the price plunged to $12 in two short months. Although silver rose above $20 per ounce again later that year, it quickly reversed course and that price level would not be seen again for decades. By mid-1981, as Paul Volcker began his quest to break the back of inflation, silver had fallen below $10 per ounce. Silver remained in steady decline for a majority of the decade, closing at just above $5. Contrary to many other commodities, silver prices experienced minimal volatility during the 1990's and ended the decade practically where it had begun. The early part of the new century brought little change for silver prices as well. In 2004 the U.S. economy was back on track and interests rates remained very low, helping spur demand for commodities. Breaking out of a nearly 15-year range, silver's slow rise became more dramatic entering 2008 when prices rose above $20 per ounce for the first time since 1980. Then the credit crisis struck and a period of deflation began, sending silver back below $10 per ounce in 6 months. As silver hit a trough, interest rates were being lowered dramatically around the world and fear sparked demand for precious metals. A combination of fear, economic growth, negative real interest rates and money printing have greatly increased demand for silver since. After nearly doubling in 2009, the price of silver has risen nearly another $10 in the past 4 months and currently rests near $30 per ounce.     
Sugar
   Sugar's price movements over the pat 30 years resemble that of silver. In 1980 alone, the price of sugar nearly doubled from $0.22 per pound before ending the year slightly above $0.30. Only 16 months later, the price would fall below $0.10 and by mid-1985 the price rested barely above $0.02 per pound. Sugar would rally back in the second half of the decade, finishing the 80's around $0.13 per pound. Prices fluctuated minimally most of the 1990's before a rapid decline in 1998-1999 dropped the price to $0.06 per pound to end the century. Once again, sugar prices bounced along the bottom until beginning a steep incline in mid-2005. By early 2006 the price nearly touched $0.20 per pound before falling back towards $0.10 later the same year. Sugar prices briefly peaked again in early 2008, though only near $0.15 per pound. The ensuing decline was equally minimal compared to other commodities. Joining the trend again, in late 2008 sugar prices began an astonishing rise from $0.12 to $0.30 per pound in just over 12 months. What has happened since is even more surprising as prices fell below $0.15 at the end of May 2010 before rising back above $0.34 this week. 

   The story of these commodity prices represents the remarkable volatility over the past few decades and especially the past several years. Although inflation is unaccounted for in these prices, actual core inflation in the U.S. (as measured by the Fed) during the past decade could only explain a minuscule portion of the rising prices. Back in 2007-2008, the main story on the street was that ever increasing demand for commodities by China and other emerging markets would outstrip supply offering a sure bet on higher future prices. Yet somehow as fear of an impending second depression spread, demand appeared to nearly evaporate. Suddenly oversupply ruled market sentiment sending prices sharply lower and spurring talks of a bursting commodity bubble. Two short years later, economic growth has picked up, governments are printing more money, interest rates in developed countries remain between 0 and 1% and global demand has picked up. Once again, the widely accepted view holds that demand will vastly exceed supply in coming years. Attempting to front run expectations, prices of many commodities have already jumped back above previous peaks with several approaching or hitting all-time highs. 

   All of this begs the question, were commodity prices in 2007-2008 a bubble? When demand appeared nonexistent in late 2008, early 2009 the answer would have seemed an overwhelming affirmative. Considering prices today, a strong argument can be made against this idea. For those considering investing in commodities today, whether through futures, ETFs or stocks, pondering this question in incredibly important. As recent experience has shown, global demand for raw materials can be far more volatile than most believed. Speculation on future prices can not be ruled out either and investor sentiment has proved even more volatile than demand. Ultimately the answer to the question may reside somewhere in the middle. Given a long investment horizon (10+ years), global demand is very likely to increase and out-pace supply. However, since that view is nearly universal, current prices may already reflect a substantial portion of the expected growth story. Either way, caution is advised, as the past 30 years have demonstrated investors may be in for a very bumpy ride!

Wednesday, December 8, 2010

Take That, Fiscal Commission!

   On February 18th, 2010, President Obama signed an executive order creating the bipartisan National Commission on Fiscal Responsibility and Reform. The group of 18 was allotted eight months to derive a plan for reigning in budget deficits and restoring America to a sound fiscal path for the future. Last week, the Commission's final report was published and is well worth reading. With every option on the table, the final report details a number of politically challenging, thoughtful and creative ideas. Although many members were unable to agree on specifics within the plan, the basic conclusion was unanimous and well depicted by the following excerpt from the preamble. "As members of the National Commission on Fiscal Responsibility and Reform, we spent the past eight months studying the same cold, hard facts. Together, we have reached these unavoidable conclusions: The problem is real. The solution will be painful. There is no easy way out. Everything must be on the table. And Washington must lead."

   Only a week after the report's release, President Obama and the rest of Congress are sending a loud and clear message back..."who cares!" This week President Obama announced a compromise with the Republican Party on the extension of tax cuts otherwise ending in a few weeks. Not only does this compromise extend the entirety of Bush and Obama tax cuts for two years, but the plan adds new tax cuts such as reduction of the payroll tax. Social Security was previously expected to deplete all funds in 2037, but new revenue cuts are likely to be pull that end date forward. A few extra tax cuts alone would not have undermined the fiscal commission, but the compromise does not stop there. On top of tax cuts, extended unemployment insurance will be continued for another 13 months. In direct opposition to the fiscal commission's report, the forthcoming tax bill will reduce revenues and raise expenditures without any plan for future deficit reduction. On the whole, the tax compromise is likely to add upwards of $1 trillion to the deficit over the next two years.

   With tax rate questions now practically answered (the bill could fail, inflicting serious negative consequences), the likely economic effects can be analyzed. Looking at the positive aspects, lower taxes should boost short-term GDP growth and extending unemployment insurance will prevent millions of Americans from falling short on bill and mortgage payments. It's also conceivable that increased spending spurs further spending, resulting in rapid economic growth and shrinking unemployment. Although possible, the Bush tax cuts of 2001 and 2003 fail to offer much substantive truth behind this notion. Make no mistake, letting the tax cuts expire for 98 percent of Americans would have likely have had terrible consequences for the economy and equity markets. Despite this view, numerous questions remain regarding the efficacy and effects of the tax compromise.
 
   Let's start with the basics, expectations for GDP growth. Many economists and equity market strategists have been quick to raise 2011 GDP growth expectations in light of lower tax rates. Most have added between 0.5% and 1% to expectations, however a Citigroup report now projects 4.5-5% growth for the coming year. However, the extension of tax cuts should not be mistaken for actual tax cuts. Unless the majority of Americans had truly expected their tax rates to rise at the end of this year (despite Congressional agreement on maintaining tax cuts for the bottom 98%), expectations will not be changed by this bill and therefore action is unlikely to alter greatly either. Further, current tax rates are only guaranteed through 2012 which still leaves businesses with tax uncertainty for large capital projects. Although failing to maintain current rates for most Americans may have thrown the economy back into recession, it remains unclear how much extra growth will be generated by holding them constant.

   Next we'll consider the further extension of unemployment benefits. These benefits will almost certainly be used for consumption and therefore provide added stimulus to the economy. However, quietly ignored by this compromise was any extension of benefits for 99ers, those Americans who already exhausted current weekly maximums for unemployment benefits. A couple million Americans currently hold this designation and the President's Council of Economic Advisors recently calculated another 4 million may stop receiving benefits next year. Having several million people out of work without any benefits is likely to be a drag on the economy.

   Finally, tax rates benefiting the wealthy were seemingly the biggest compromise made by President Obama. The main benefits to highest income groups include holding tax rates at current levels for income, capital gains and dividends, as well as setting the estate tax at 35% with a $5 million individual exemption. In his speech, President Obama made his disapproval of these measures extremely clear. What's been most intriguing in the argument to raise taxes on the wealthy, is how directly its premise opposes Federal Reserve Chairman Ben Bernanke's premise behind QEII. President Obama and Democrats (correctly) argue that providing extra income to the wealthiest few percent of the population leads to a minimal increase in spending and more saving. To the contrary, Chairman Bernanke has suggested that quantitative easing will support asset prices and resulting capital gains will drive increased spending. With nearly 85% of stocks being held by the top 15% of the population, its clear the burden of rising expenditures falls on the wealthy. Extensive research has been done on the wealth effect and much of it supports only a minimal impact on consumption. Unfortunately President Obama has been forced to the opposing side, for which the likely outcome is continuation of widening disparities in the general population.

   So what's the take away from this news with regards to investing? In response to the tax compromise, bonds have sold off sharply reflecting some combination of perceived higher GDP growth, inflation, deficits and debt. Treasury maturities between five and ten years have witnessed yields rise nearly 1% in the past six weeks, breaking significant technical strength. On November 4th, in Fighting the Fed, I recommended shorting Treasuries through use of a couple ETFs, PST and TBT. Since then, each security is up over 11% and further upside seems limited. At this point I'd recommend selling out of those positions and have done so personally, reducing my position by approximately 90%. Rising yields have already impacted other markets as yields now offer a more reasonable alternative to stocks and rising mortgage rates are pressuring an already weak housing market. If Treasury yields rise further, to 5% on 30-year maturities, it may become prudent to reverse course and go long bonds.

   As yields and the dollar rose recently the stock market has managed to hold onto yearly gains. Previous columns have outlined the extreme optimism that currently persists within the market. Several headwinds linger  preventing a sustainable economic recovery from taking hold and limiting corporate earnings growth going forward. Expectations for S&P 500 earnings growth have already come down significantly for next year to about 10%. Based on these views, the stock market remains slightly overvalued at this juncture. My recommendation is therefore to raise some cash and wait for a better opportunity to enter select stocks, ideally with strong dividends.

Disclosure: Long Proshares Ultrashort 7-10 year Treasury (PST) and Proshares Ultrashort 20+ year Treasury (TBT).

Tuesday, November 23, 2010

Toes in the Water

   After yesterday's sharp decline in the markets and stark reversal thanks to a few high-flying names, the market appeared to be sitting on fragile ground. When North Korea fired several artillery shells at a South Korean island overnight, equity markets dropped across the globe. Combined with fears of European sovereign debt and slowing Chinese demand, the global economic outlook is showing signs of strain. Although Ireland appears to have an EU/IMF bailout in place, all eyes are quickly shifting to Portugal and Spain. As concerns creep back into the marketplace, today marked a strong "risk-off" day.

   For those who have been reading this blog, my outlook for the market the past several weeks has clearly been cautious at best. In the previous post, Optimism Reigns, I went as far as calling for a 5-8% correction in the near future. As equity markets sold off today, the Dow briefly broke below 11,000, marking a nearly 4% drop in just over two weeks. Although I expect the decline to continue for at least another week or two, for the first time in a couple months, buying opportunities are showing up on my watch list. 

   Abbott Laboratories (Ticker: ABT) is a broad-based health care company that discovers, develops, manufactures and markets products and services that span the continuum of care – from prevention and diagnosis to treatment and cure. Abbott's principal businesses are global pharmaceuticals, nutritional and medical products, including diagnostics and cardiovascular devices. Abbott's earnings have grown nearly 27%, on average, the past three years and are expected to increase an average 11% for the next three. On top of earnings growth, the company currently sports a dividend yield of 3.75% and has increased dividend payouts for 38 consecutive years. The stock currently trades for only 10 times forward earnings expectations making it a strong value play and a good buy under $47 (closed at $46.95 today).

   RR Donnelley (Ticker: RRD) provides solutions in commercial printing, forms and labels, direct mail, financial printing, print fulfillment, business communication outsourcing, logistics, online services, digital photography, and content and database management. No question business has been tough due to the recession and a technological shift to online advertising. However, as the largest printer in North America with strong positions across the globe, earnings should improve as advertising picks up. Earnings are forecast to grow about 17% next year while the stock currently trades at just over 8 times forward earnings. The most enticing feature of owning the stock is its current 6.5% dividend yield. RRD closed at $15.97 today and I'd be a buyer below $15.85. 

   Given the murky outlook for economic and equity growth over the next year, the aforementioned stocks offer comparable yields to bonds with potential for further capital gains. As mentioned earlier, the recent downtrend is likely to play out for a bit longer and therefore I'm hesitant to dive in on the long side. At this point, buying a third of a typical position and waiting for further pullbacks would be advised. While the outlook remains rocky, the timing seems right to dip a couple toes in the water.

Disclosure: Investors should do their own analysis of all recommendations to determine their suitability for any portfolio. Long ABT and RRD.
   

Sunday, November 21, 2010

Optimism Reigns

   As we head into a shortened week due to the Thanksgiving holiday, it seems unlikely that market volumes or volatility will be too high. After last week's dramatic decline and massive rise that ultimately moved markets very little, reduced volatility may be a welcome change for many investors. With the final month of the year approaching and many expecting a Santa Clause rally to take hold soon, it appears markets are poised for another year of double digit gains.This news may come as a surprise given that much of the talk the past few months has been about the wall of worry surrounding stocks. Although this talk has been common practice amongst market participants, it may not hold real weight in the investment community.

   A commonly used phrase I'm sure you've heard is that "talk is cheap." One thing I've certainly learned in my lifetime is that words only really matter if a person's actions back them up. These past few months it appears that much of the cautious or negative talk on Wall Street has been just that. A survey of big fund mangers by Bank of American Merrill Lynch recently showed "market sentiment at its most bullish since April 2010." For those who don't recall, April marked the previous highs for the year before fears of European sovereign debt caused equity markets to drop over 15% within several weeks. Although this level of bullishness could be cause for concern, as long as funds are sitting on loads of cash there should still be room to run. Unfortunately, this does not appear to be the case as average cash holdings fell to only 3.5%. If these surveys truly represent large funds on the whole, one has to wonder where future gains will come from.


   Although large investors and funds may already be largely invested, there remains hope that individual investors will finally succumb to recent stock market gains, jumping out of bonds and back into stocks. This shift in allocation is viewed as a potential driver for the next leg of the bull market rally. However, the American Association of Individual Investors (AAII) Sentiment Survey recently found 58% of investors bullish, the highest reading since the market topped out in 2007. While equity fund outflows may continue, given the degree of bullishness in the market, it remains unclear what level would need to persist to bring money back into equities. For anyone who remembers the past few bubbles, it is typically the individual investor that got to the party last. Therefore, any sign this group is coming back to stocks in a meaningful way may be a good sign that the rally is almost over. 


   As the title of this blog suggests, I'm a clear believer that our future economic path will be largely defined by more frequent bubbles and bursts. Given my weak outlook for the real economy, equity markets appear to be setting the foundation for the next bubble. Though this may play out over a couple years, recent bullishness and market gains suggest a pullback may be in order. Despite the nearly 3% drop a week ago, a more meaningful pull back of 5-8% is likely necessary to move sentiment back to typical levels. 


   I've listed a few articles below related to the topic discussed and from which some of my data was found. The articles are listed in order of preference given any time restraints or desire by the readers...enjoy.


The Cliff by John P. Hussman, Hussman Funds
Market Optimism Is Ominous Sign by Breet Arends, Wall Street Journal
Smart Money Is "Selling the News" by Ron Coby, Minyanville 

Thursday, November 18, 2010

An American Icon Returns

   The first half of this week has been more chaotic than any the past few months as QE2, Irish debt and Chinese monetary tightening have weighed on the markets. After falling rapidly yesterday, the stock market managed to maintain the flat line amidst a slight pullback in the dollar and renewed data showing minimal inflation in the U.S. Bond markets in the U.S. have continued their wild ride since QE2 began on Friday. After rising sharply on Monday, yields dropped at the open Tuesday, rallied back and then fell dramatically into the close. Today, yields started the day to the downside then moved lower throughout the morning before making a strong comeback to finish the day moderately higher. Commodities and emerging market stocks have sold off considerably as well in response to forthcoming Chinese tightening and potential price controls. Despite all this news, general conviction remains that this is a much needed correction and I'd agree a few buying opportunities are starting to arise.

   General Motors (GM) greatly anticipated return to the public market has finally arrived. The size of the IPO has been increased substantially and the initial $33 price tag is at the high end of an already heightened range. Considering all the hoopla leading up to tomorrow, it seems likely the stock will shoot upwards when it opens. After the initial hype subsides, likely next week, the real questions will start to be answered. Although some investors recently have opined that GM was merely an unfortunate consequence of the recession, I'd beg to differ. Years before the recession began, GM was saddled with a cost structure equivalent to paying salaries more than twice that of foreign competitors. Due to concessions made to the UAW, retiree benefits were spiraling out of control. At the same time, GM was burdened with several unpopular brands and numerous gas guzzling vehicles that fell out of favor as oil prices soared. Based on these fundamentals, GM's fate may have been sealed before the recession, which merely finished off the job.

   Oddly, the recession may also have been a blessing in disguise for GM. As the country watched in horror as millions lost their jobs, saving the American icon and its couple hundred thousand jobs was imperative. Over the past two years, with government aid, GM has disposed of several brands, written off billions in debt and restructured contracts with the UAW. GM is absolutely a stronger company now than it was before bankruptcy. However, is it so certain that the problems of the past will not come back to haunt the company? As profits roll in and the government ultimately relinquishes its stake, will the UAW not fight for better compensation? If oil rises above $90 or $100, will the current lines of not so fuel efficient vehicles still be in demand? Beyond these questions, trying to predict the future earnings at this time is incredibly difficult. What if cash for clunkers has brought a significant portion of demand from the next couple years forward? For my money, the current hype and high expectations aren't worth the risk of buying in at a potentially terrible price. As interested as I am in the outcome over the next few days, I'll be watching this IPO from the sidelines.

Monday, November 15, 2010

Options Market Offers Contrary Signal

   This past weekend, Barron's ran an article titled In Love With Stocks, Again by Steven M. Sears. The article points out the recent apparent lack of fear in the market through a view of the Options markets. For those less familiar with options, skew refers to the difference in implied volatility between calls (rights to buy stock at a given price) and puts (rights to sell stock at a given price). Skew offers a good way to interpret any current bias in the market. During normal periods skew is positive since stocks tend to fall faster than they rise, implying greater volatility. Sears notes that recently skew has flattened dramatically on the heels of QE2, implying the expectation of reduced downside risk in the market. Although this may be correctly interpreted as a bullish short-term signal, history tells us that when investors believe risk is marginal, the time to sell is near.

   Today was marked by a continuation of the recent reversal in Treasuries. Since announcing QE2, 10-year yields have risen nearly 60 basis points to almost 3%. The sell-off across all maturities has been dramatic since the Fed actually began purchasing Treasuries on Friday. If the Fed's continued purchases cause further sell-offs and rising yields, could they be inclined to cut the program short? What level of inflation or unemployment in the next 8 months could also be cause for a shortened QE program? Although these outcomes seem improbable, at times of such certainty, unexpected events may actually carry the greatest risk.

[b-CBOE-1115]

Sunday, November 14, 2010

Fed Stands in Own Way on Monetary Policy

   Have you heard much about interest on reserves during the past couple years? Well I haven't either, but this little discussed topic may be having enormous consequences for financial markets and our economy. To lay out the groundwork for the argument, it is important to begin by looking at the level of bank reserves within the U.S. financial system and their relation to economic growth and inflation. By law, banks are required to maintain a specific portion (10% in the U.S.) of their deposits in excess reserves. This amount is intended to provide enough emergency funding in the case of a liquidity crisis or bank run for the bank to avoid becoming insolvent. Under normal circumstances including the years preceding the Lehman bankruptcy, banks tend to hold minimal, if any, reserves in excess of those required. These circumstances persist because banks earn zero return on reserves and therefore are better off loaning or investing the funds at any rate greater than zero. Following Lehman's bankruptcy in September 2008, the above normal situation changed dramatically, but not for the reasons many believe.

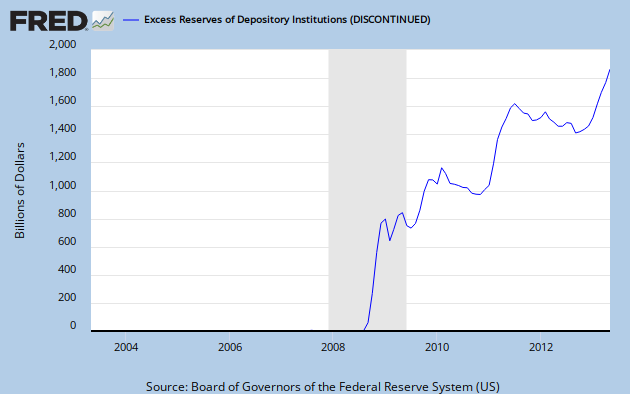
   Prior to the Lehman Brother's bankruptcy, required reserves in the U.S. were around $40 billion and excess reserves were a measly $1.5 billion. However, as credit markets seized up in September 2008, excess reserves began growing rapidly as would have been expected. What was generally unexpected though was excess reserves, which initially peaked around $800 billion in January 2009, not only failed to decrease but have increased after credit markets unfroze (shown below). For the past two years, these massive excess reserves have been used to criticize banks for not lending enough. Although there may be many arguments for why such large amounts of excess reserves have been accumulated, one reason above all others was articulated by a couple staff economists working for none other than the New York Fed itself. The report Why Are Banks Holding So Many Excess Reserves?, by Todd Keister and James McAndrews, argues that the Federal Reserve's decision to pay interest on reserves (IOR) is the primary explanation for the accumulation of reserves.


FRED Graph
    
  
   In October 2008, attempting to thaw credit markets, the Federal Reserve for the first time in its history elected to start paying interest on reserves held at banks. As the Federal Reserve began purchasing assets from banks, reserves piled up and confidence in short-term credit facilities returned. For its original intended purpose, paying interest on reserves appeared to work well. However, as the Fed shifted its priorities from opening up credit markets to jump starting the economy, this policy would prove extremely counter productive.

   While credit markets began to ease in late 2008, the economy was still mired in a terrible recession and confidence was severely lacking. In March 2009, with the stock market plunging to new lows, the Fed announced a new quantitative easing program including purchases of mortgage-backed securities and Treasuries. At the time, the Fed Funds rate, which determines short-term interest rates, was already anchored near the zero bound. Quantitative easing was therefore designed to increase the money supply, driving longer-term interest rates lower and generating greater spending. Lower interest rates by their nature increase the number of alternative investments that would be more profitable, encouraging banks to ramp up lending practices. Each extra dollar added to the money supply is generally expected to create even further growth in the money supply due to a multiplier effect. This basic premise is that banks will lend the extra funds, which once spent end up as deposits in another bank. That bank will lend the excess reserves, above the minimum requirements, and this process will occur many times over until nearly all excess reserves are removed from the banking system. Quantitative easing is therefore expected to enlarge the money supply beyond its initial scope, generating increased consumption and ultimately higher economic growth and inflation.

   The above scenario is what was supposed to happen after QE1 and what is hoped will occur with the establishment of QE2. Unfortunately, if the Fed staff economists are correct (which appears to be the case), the Fed's own policies should be expected to nullify the effects of quantitative easing. As stated in the research report, "if the central bank pays interest on reserves at its target interest rate,..., the money multiplier completely disappears. In this case, banks never face an opportunity cost of holding reserves and, therefore, the multiplier process described above does not even start." To help explain this phenomenon, let's consider the current interest rate environment. The Fed Funds rate is currently being held between 0% and 0.25%, with these rates expected to remain constant for at least a couple years. Based on these rates, Treasury bills and notes ranging from 30-day durations out to a year have generally held within this range. Although these investments are liquid, Treasuries are exposed to interest rate risk. At the same time, the Fed is currently paying interest on reserves equivalent to 0.25% per day and without the same risks. In this real world scenario, the Fed is actually paying interest on reserves above its target rate, affording banks the rare opportunity to earn greater returns with reduced risk. Looking at this scenario, its no wonder why excessive reserves have remained incredibly high and the Fed has been unable to spark inflation. 

   There are a few other interesting takeaways from this discussion. For one, banks have received much criticism for being too stringent in providing loans and for maintaining such large sums of excess reserves. Upon review, it appears that the decision to maintain massive excess reserves is not only entirely rational, but even encouraged by Fed policy. As for the Fed, one has to question if the Fed will ever stop paying interest on reserves in the future. Doing so with current interest rates would likely spark a quick and enormous increase in the flow of funds throughout the global economy. Although this would likely spur economic growth it could also be expected to unleash painfully high inflation. If the Fed continues paying interest on reserves, future decisions to raise the Fed Funds rate above that paid on reserves may risk creating the same problems. For better or worse, the Fed must now consider a new set of variables when making policy decisions for the foreseeable future.

Friday, November 12, 2010

We've Been Here Before

    As Citigroup outlined several days ago, the trend following QE announcements has been for the dollar to strengthen and Treasury yields to rise. Since QE2 was announced last week, the dollar has risen by about 2.5% and 10-year yields have risen about 7 basis points. Although a weakening dollar and falling yields are widely viewed as bullish for the stock market, the opposite action has not materially weakened the current rally. Despite claims that the market is failing to appreciate positive economic news any longer, today offered an example of the opposite.
  
   Last night, Cisco (CSCO) made public the results of their most recent quarter and offered guidance for the coming quarter depicting significant weakness in sales and profits from expectations. For years, Cisco has been considered a bell weather of the tech sector, providing a valuable gauge on the outlook for general tech spending. Cisco's highly regarded CEO, John Chambers, is also well known for his honest but generally optimistic forecasts. Yesterday on the company's conference call, Chambers said the company faced a "challenging economic environment" and noted the "competitive landscape is getting more intense." These comments combined with an earnings estimate nearly 20% below estimates for the next quarter sent the stock down nearly 17% on the day. Disney also reported earnings today and did so surprisingly (by accident?) during market hours. Disney's earnings and revenue both came in below expectations causing the stock to sell off 3% on the news. Although Cisco witnessed its largest drop in 12 years and Disney reported weak numbers, the overall market managed to hold losses below 1%. This may be good news for stocks, however, for investors who believed volatility and risk were subsiding, Cisco proved that an earnings miss from a large cap corporation can still have devastating effects.
  
   It appears a primary reason the market has maintained recent gains in the face of a strengthening dollar has been the even more impressive resilience in the commodity markets. Recent news from China showed that inflation was rising faster than expected and although China is nearly certain to continue raising rates and reserve requirements, it appears many investors doubt the nation's ability to truly slow consumption or inflation in the near future. Unsurprisingly, QE2 has sparked dramatic gains in gold, silver, copper, many other metals and raw commodities alike. As these prices continue their upward momentum, so goes stocks of commodities and materials companies.
  
   While these stocks may retain current upward momentum, it's important for market participants to remember the simple fact that in any market there is a buyer and a seller. I mention this because in order for companies such as Freeport McMoran Copper & Gold to lock in profits from the higher prices of commodities, the company must be able and willing to sell their goods at current prices. However, on the opposite side of the sale is another company being forced to pay higher prices for the same goods. The purchasing company will either face reduced margins due to higher costs or possibly pass along the price increases to the end consumer. In the latter scenario, the consumers' available funds for purchasing other goods is reduced, lowering revenue for firms in other sectors. While this is a very basic overview on the effects of rising commodity prices, it offers a convincing explanation of why forever rising commodity prices will not in itself support higher market valuations. 

 
A Look to the Past
 
  Let's take a moment and think back to the beginning of April this year. Following a correction in equity markets that bottomed on February 5th, the Dow, S&P and Nasdaq rallied sharply for the next two months each gaining more than 10%. As April began the Dow stood at 10856.63. Also of note, the dollar index closed at 81.073, the VIX was at 17.59 and yields on 2-year Greek bonds sat at 5.119%. At the time, analysts and investors were overly bullish on the prospects for continued gains in the market and envisioned 3-4% GDP growth or better in the U.S. for the foreseeable future.
 
   Everything seemed to be moving in the right direction, but then news began to circulate about Greece's hidden debt and the potentially dire state of their government financing. Over the next several weeks, the yield on Greek 2-year bonds steadily rose to just above 7%. Even with the yields and corresponding CDS (credit-default swaps) on Greek debt rising, most market participants believed the chances of Greece defaulting were remote and even if it were to occur, the country was too small to have much impact on the U.S. Given this outlook, stocks rose another few percent while the dollar held steady and the VIX fell below 16. As debate over the true depth of Greece's budgetary problems continued, the market for Greek bonds took a turn for the worst on April 22nd. That day, Greek bonds feel dramatically, pushing the yield on 2-year notes above 10%. Once again, the impact of this sell off on other markets was muted. Heading into the weekend, the Dow rested above 11,200 at a new 52-week high. 

   As markets reopened after the weekend, selling pressure on Greek bonds continued in earnest, sending yields soaring to nearly 16% by the close on Wednesday, April 28th. For the first time, concerns about a potential Greek default began to infect other markets as the VIXDXY) rose 2.5% to 84.45 and the VIX doubled to close at 40.95. Most stunning was the Dow's drop from a close of 11,151 on May 3rd to 10,380 on May 7th, which included the "flash crash" drop of 1,000 points in a matter of minutes on May 6th. 

   Acknowledging the severity of the situation, over the weekend the ECB announced plans to effectively bailout Greece through an extension of loans. The markets responded with exuberance as Greek yields fell more than 10%, the VIX dropped 30% and the Dow rallied nearly 4% on Monday, May 10th. Currency markets didn't respond as positively to the ECB's plan and over the next month the Euro would fall below $1.20 against the dollar, sending the dollar index to its one year high above 88. Since then the ECB has put in place further backstops for Greek debt, while Greece has established numerous austerity measures to reduce budget deficits. Despite all these actions, the yield on 2-year Greek bonds still sits above 11% today and default remains a real possibility for the future.

   Now let's turn to the recent worries of an Irish default in the near future. These fears crept up in mid-October while the yield on 2-year Irish bonds stood at only 3.52%. As a reference, on October 14th, the dollar index was at 76.647, the VIX was below 20 and the Dow was at 11,095 in the midst of a two-month (or more?) rally. Over the following three weeks, Irish yields rose to over 4.3% but other markets mostly shrugged off any potential effects from an Irish default. However, a week ago, yields on Irish 2-year notes jumped to nearly 5% and have continued rising ever since. While the Fed may have announced another $600 billion in quantitative easing, growing concern over Irish debt has pushed the dollar index up 2%. After closing at a new 2-year high of 11,444, the Dow has fallen off slightly the past week. The ECB is currently working out a plan to avoid an Irish default, but in the meantime it appears likely that Irish yields will continue their rapid rise. Most notably, the ECB has suggested that part of an Irish bailout would require bond holders to accept some losses in any restructuring. This is a significant divergence in the post-Lehman era, where bondholders have consistently been made whole, and may spark even greater fears. 

   Today, market participants are again ignoring the Irish crisis, presuming the country is too small to materially impact the U.S. If the experience of Greece taught us anything, it's that fear can spread extremely quickly and exceed most people's expectations. As I look ahead to the following couple weeks and potential impact of Irish sovereign default fears, I'm constantly left wondering, haven't we been here before?

Sunday, November 7, 2010

Weekend Reading

   With President Obama opening up to the idea of extending all the Bush tax cuts, that outcome seems ever more likely. Investors will certainly rejoice with this news as it should offer clarity and hopefully a boost to the economy. However, an unpleasant side effect of this decision would occur within the OMB and CBO's economic outlooks. Currently, the two reports have been using a baseline assumption that all the Bush tax cuts would expire at the end of 2010. Based on recent projections, maintaining the tax cuts would likely add several trillion dollars to the budget over the coming decade. If the tax cuts are extended prior to the next releases, the budget deficit and debt projections will surely take a significant hit and may appear far more drastic. A couple recent articles offering detailed and perceptive views on the U.S. debt outlook are certainly worth reading...


  • A Hidden Fiscal Crisis by Laurence J. Kotlikoff argues that current measures widely understate the fiscal problems that are present in data on the fiscal gap.
  • Managing the Federal Debt by Jason Thomas details Treasury market proceedings and the potential issues with relying on short-term financing.

Saturday, November 6, 2010

Do valuations matter?

   Since the start of the financial crisis back in the fall of 2008, I've become a CNBC junkie. For anyone not familiar with the channel, there a couple important things to be wary of. On the positive side, the channel offers the most comprehensive news on the economy and markets, while engaging the biggest name in the business on a daily basis. On the negative end, as with most media, the severity of the news and effects are often overstated. In defense of CNBC and its analysts, the shows rely on their ability to interpret each market move as cause and effect with current news. This is an unreasonable expectation from the start, especially in a forward looking environment often impacted simply by change in emotions.
   Its also critical to recognize that within the investment community there is a real premium on maintaining the status quo, which forces analysts and advisers to generally converge around a common outlook. Considering the volatility experienced during the past couple years, another crucial recognition is that most commentators on the network are providing investment outlooks for the next few weeks or months at best. This is probably the best example of how long-term investing has fallen out of style. Due to this, investors with a time horizon greater than a year or two, will likely find much of the recommendations worthless. Despite this weakness in programming, writing off the accompanying discussions would lead to missing out on very valuable information. If we assume that today's trading volume is dominated by these individuals, funds and institutions, than understanding their views offers significant insight into the current market psychology.
   Thursday afternoon, the "Fast Money" show offered a wonderful example of the strengths and weaknesses of the network. A brief overview of the show is that each day a panel of four traders explain their views on the day's action and best trading ideas. The traders are part of a small group, likely selected for their impressive track records and entertaining personalities. Although I don't frequently act on any of their trading recommendations, I find the conversation to be very insightful. Thursday was a perfect example of the dichotomy between long-term investment rationality and a short-term trading mentality. As the traders discussed the impressive market gains on the day, the general conclusion was that investors have to be long the market at this point. Despite concluding that markets will likely continue moving higher, the group was also  nearly unanimous that the longer term outcome (likely meaning a few years) would be disastrous. This view, maybe surprisingly, has actually been offered frequently on CNBC over the past several months. If this view turns out to be correct, it's doubtful that all those buying in the dash higher will be able to sell before the crash occurs. That is a discussion for another day though. Getting back to "Fast Money", my favorite comment Thursday came from Guy Adami, a frequent and entertaining contributor. Speaking about some recent high flying stocks, Guy suggested that valuations no longer seemed to matter in the names. Enticed by this statement, I decided to take a look into the current valuations on some of the biggest, recent gainers.


    [Earning per share (EPS) data from 2006-2009 was obtained from Google Finance. EPS 2010-2012 estimates were gathered from Bloomberg and reflect the average of many analyst estimates. Growth numbers reflect expected percentage changes in earnings from the previous year. Average growth reflects the average of the two growth percentages. Price-to-earnings multiples (P/E) are calculated using the closing price from Friday (11/5) and respective earnings estimates.] 

   A quick overview of the earnings data and valuations provides some intriguing and unexpected insight. Based on expected earnings growth over the next two years, most of these stocks do not appear widely overvalued on a 2011 or 2012 P/E basis. In fact, the top 4 listed, Amazon (AMZN), Priceline (PCLN), Netfilx (NFLX) and Baidu (BIDU) appear pretty fairly valued. On the other hand, Chipotle (CMG), Salesforce.com (CRM) and Wynn Resort (WYNN) seem to be trading at rich valuations.  For example, if CRM simply meets expectations over the next two years, investors will need to pay 60 times 2012 earnings for the stock to merely maintain its current level. As for the other two securities on this list, while Las Vegas Sands (LVS) appears cheap at current valuations, the deterioration in earnings  and significant losses over the preceding few years implies considerable risk and volatility in future estimates. Meanwhile, F5 Networks (FFIV) similarly looks reasonable based on current and next year's earning expectations, however the company will need to earn $2 per share in the final quarter of this year to meet expectations ($0.56 per share was the best quarter to date).

   Although these valuations provide a rough overview for the securities, it should be taken as just that. In general analysts have a very poor track record of predicting earnings a couple quarters out, let alone a couple years. Also, the valuations in a couple years should reflect earnings expectations for the following couple years. Over time, as companies mature, one would expect the size of earnings growth to shrink along with P/E multiples. Therefore, many of these companies may find it tough to maintain such impressive growth over the next 3-5 years plus. However, as the "Fast Money" crew and many others have suggested recently, these stocks continue to run up in price and at some point you've got to get on board. Valuations may not matter today, but they will at some point...right?


Disclosure: No Positions in AMZN, PCLN, NFL, BIDU, LVS, CMG, FFIV, CRM or WYNN.

Friday, November 5, 2010

Earning "real' returns

   In the aftermath of the elections and Fed decision, the dollar broke through support to the downside overnight, sending stocks, commodities and bonds in a race to the top. When word broke during the morning that president Obama was open to extending the Bush tax cuts for all income levels, the gains grew even larger. Despite an unexpected rise in weekly unemployment claims back above 450,000 coupled with Goldman Sachs cutting expectations for tomorrow's jobs number, the Dow roared higher by more than 200 points.
 
   Several new milestones were hit today in the markets, as the Dow, S&P 500 and Nasdaq traded to their highest levels in over 2 years. On the bond side, 2, 3, 5, and 7-year treasuries all touched record prices, offering new low yields of .31%, .43%, 1.01% and 1.69% respectively. Given the Fed's presence in the Treasury market and commitment to purchase issues with an average maturity of 5 to 6 years, these yields are both sensible and confounding at the same time.
 
   To understand this dichotomy it is important to consider the investment merits from various points of view including the Fed, Foreign nations, Banks, Mutual/Hedge funds, pension funds and basic investors/savers. Before diving into the multitude of investment reasons, a quick review of the difference between nominal and real gains appears necessary. For anyone unfamiliar with these terms as investment references, nominal means an unadjusted rate, value or change in value. On the other hand, a real rate of return refers to the annual percentage return realized on an investment, which is adjusted for changes in prices due to inflation or other external effects. (Definitions from Investopedia) So why are these terms so important at this time?

   The true difference between nominal and real returns over time is the effect on an individual or corporations purchasing power. As an example, let's assume that an individual earns 5% a year on their investments. During that same year, due to inflation, their cost of living rises 3%. On a nominal basis the individual is 5% richer at the end of the year. However, in terms of the extra percentage of goods this individual can purchase at the end of the year, their real return is only 2%. Recognition of real returns is critical at this time because it appears many investors in the market are accepting negative real returns. 

  Based on the most recent reports of inflation watched by the Fed, core-CPI (Consumer Price Index) and core-PCE (Personal Consumption Expenditures), inflation is rising about 1% year over year. Although these measures exclude food and energy prices due to volatility, I'll hold off on that discussion for a future date. The Fed's recent actions clearly show their intent to not only prevent further disinflation or push it back to their previous goal of 2%, but increase inflation for a time above 2%. It's obviously too much to expect the Fed's actions to have an immediate effect, but based on recent TIPS auctions, it appears many investors are expecting inflation to pick up over the next several years. Now let's look back at the prevailing yields on Treasury securities today. If inflation merely holds at 1%, those holding 2 and 3-year issues will face real losses. Were inflation to pick up in the next few years and reach the Fed's targets, investors in 5 and 7-year issues will also see real losses. The question then becomes, why are investors so eager to own these securities?

   Let's start with the Fed itself, which has a mandate to maintain full employment and stable prices. To achieve these goals with interest rates at 0%, the Fed is attempting to create negative real rates and push investors further out on the risk spectrum. Although the Fed continues to buy these securities, the Fed is allowed and willing to accept real losses in the interest of the economy as a whole. Foreign nations also remain a significant investor in U.S. Treasuries. Many of these nations use these purchases as a function of controlling their exchange rate with the U.S. and maintaining their respective export advantages. 

   Banks often use Treasuries for storing excess reserves, which are currently larger than they've been in a long time, but also trade the securities on their proprietary desks. In this way, banks buy and sell Treasuries for much of the same reasons as mutual funds, hedge funds and pension funds. This group is generally forced to invest capital somewhere and Treasuries offer the most liquid market available. For these investors the investment premises become more troublesome. Although Treasuries offer a safe investment and balance out risk, many within this group are likely investing in Treasuries with the intent to sell the securities at higher prices (lower yields) before they mature. These reasons are likely the same as many individuals, however without the requirement to invest. Though this all sounds simplistic the game is far more complex and risky than it seems.


   These scenarios may be highly unlikely and could play out of several years, but one has to question the effects of so many investors holding Treasuries at negative real rates. Are the investors aware that they are losing purchasing power of time? Do these investors believe the U.S. is destined for a Japanese style destiny with consistent deflation? How long will foreign nations continue to accept such low returns? Will pension funds be forced to renege on their commitments failing to reach their target gains of 8% a year?

   An interesting side note announced by the Federal Reserve yesterday was the decision to waive a 35% per issue limit on portfolio holdings. Despite announcing that increases beyond this level would be done moderately, what will happen if a future auction shows weak demand? What are the consequences of the Fed holding more than 35% of an outstanding issue? If the Fed were ever to attempt reducing their balance sheet, where would the demand come from? Would it be there?

   From my perch, buying any object at an all-time high is a risky business, even when the securities are theoretically the safest in the world. While the trend is certainly higher in the short term, only a few years out lie numerous risks to the investment thesis. As for investors solely desiring to protect their money, make sure to understand the risk of lost purchasing power if inflation begins to trend higher. Guaranteed nominal returns may sound appealing, but its those individuals with the best real returns who get ahead in the long run.

Thursday, November 4, 2010

Fighting the Fed

   The midterm elections and Fed announcement have come and gone almost exactly in line with market expectations. Despite some expected volatility, the markets to this point have taken the news in stride. Trends have continued with the dollar falling and prices in nearly everything else rising. As mentioned previously, I believe the real tests for the economy and markets are still to come, a view unchanged by a Republican house or an open-ended 8 months of quantitative easing.

  As many in the market have cautioned for a long time, it is unwise to fight the Fed. The premise is that given the Fed's ability to print an unlimited sum of dollars, any market which they choose to prop/bid up is in their realm of ability. Based on this notion, investors have raced into stocks and bonds, assuming the Bernanke "put" will prevail in the event of a deteriorating market. Although some bears may make the argument that eventually the Fed will unwind its balance sheet and raise interest rates, this day of "reckoning" may still be years off. For those with a short memory, it was only the summer of '09 when a budding recovery spurred expectations of significant job growth and rising rates by the fourth quarter of '09. As recently as this past spring, investors awaited word of exit strategies by the Fed and envisioned rising rates some six months out. Today, the Fed announced a new $600 billion in Treasury purchases lasting through the middle of next year and left open extending the program.

   Tucked away in the announcement by the Fed today was the view that inflation would remain below acceptable levels for some time. It seems reasonable to expect that the new program of quantitative easing was baked into this outlook for the future. In this light, the Fed's current actions seem a bit strange and leave some important questions unanswered. First, if the Fed doesn't believe $600 billion will be enough to significantly move the needle on inflation, why not start with a much larger sum? Second, if the Fed expects inflation to remain too low in eight months from now, is it unreasonable to assume an extension of QE2 or announcement of QE3? Drawing on this insight, let's presume that quantitative easing is extended and continues through the end of 2011. Previously the market expected that at least six months would pass after the Fed began selling assets before initially raising interest rates. Making a guess that the Fed will avoid shrinking its balance sheet for at least six months after they finish easing, the earliest possible Fed rate increase wouldn't be until some time in 2013.

   Using these expectations as a base case, one can understand why investors would assume they are in a "win-win" situation. If the Fed is wrong and the economy improves at a quicker pace, markets should surely strengthen. If the Fed is correct or the economy is worse than expected, the Fed may eventually drop money from helicopters, also sending markets higher. Although making money should be relatively easy given this premise, I feel inclined to offer a couple contrarian thoughts to the discussion.

   This morning on Bloomberg, an article referencing a Citigroup report highlighted the reaction of 10-year Treasury yields to the Fed's previous debt purchase announcements during the height of the financial crisis. Surprisingly, after the Fed first announced debt purchases in December 2008, yields rose from 2 percent to 3 percent in the following six weeks. In March 2009, the Fed announced it was increasing debt purchases and adding treasuries to the mix of purchases. Over the following couple months, yields again spiked from 2.5% to 4%. If history repeats itself with today's QE announcement, a wise investment may be to short longer term bonds for the next several weeks.

   An important counter to the previous point would be that yields have returned to much lower levels as inflation expectations waned. This certainly presents a risk to the previous trade, but it also implies that the Fed's ability to create inflation is limited at best. Although I'm not entirely convinced the Fed will achieve it's goal, failure would likely imply much more dire outcomes for stock and commodity markets over the next several years.

   One other potential crux of the recent bullish case, the topic of relative value. For several months now the media has been filled with investors arguing the relative value of stocks versus bonds as a primary reason to invest in the stock market. As an individual investor, I often have to remind myself that professional investors/advisors are paid to invest others money or offer guidance. Further, aside from those with long, strong track records, failure to beat their benchmark in a given year may result in a significant loss of capital. This is where the basic concept of relative value becomes so important. The fact that stocks may offer relatively better value than bonds (a point I agree with), only means stocks are expected to outperform bonds, not that they will certainly rise in value. In fact, it is entirely plausible that during some period of time both investments could show negative returns, but with stocks being slightly less negative than bonds. For the professional investor, the money generally has to be invested somewhere and therefore relative value is often solely important for allocating funds. However, for an individual investor, capital does not need to be fully invested or even mostly invested at all times. In fact, there are likely to be numerous times during the course of one's life where holding cash may prove to be the most valuable alternative. Therefore, one should not be swayed into buying stocks or bonds, solely on the belief it offers great value than the other. For those who believe a strong or large enough gap exists in relative value, buying the cheaper option and shorting the more expensive in a neutral position may be the best course of action.


Disclosure: Long Proshares Ultrashort 7-10 year Treasury (PST) and Proshares Ultrashort 20+ year Treasury (TBT).

Tuesday, November 2, 2010

Will 'Change' Be Fulfilling This Time Around?

   Markets were surprisingly volatile today given the major news doesn't begin until Tuesday evening when election outcomes start to roll in. After Chinese manufacturing activity (PMI) was shown to have risen to its highest level in six months, stocks appeared off to the races. Shortly after the opening bell, stocks rallied in unison with the Dow rising 125 points and showing promise of closing at a new two year high above 11,205. Treasuries also opened the day displaying strong gains and it appeared as though anyone still short either market may seek to cover in advance of the week's big events to come. Provided the background of strong demand from China, crude oil also moved sharply higher.

   Unfortunately, the impressive rally could not be sustained, as a mid-morning rally in the dollar accompanied selling in both stocks and bonds. Most telling of the capitulation may have been the declines in the biggest momentum names on the Nasdaq. A brief look at the charts of Netflix (NFLX), Amazon (AMZN), Apple (AAPL) and Baidu (BIDU) over the past few days shows a steady decline, maintained today by all but Apple. After reversing the entire gains of the morning and falling 50 points on the Dow, the markets found their footing and rallied back to neutral in the last 30 minutes. In the end it was a pretty cautious day as many investors likely cemented their positions before a potentially slower day tomorrow as the waiting game begins.

   Lost in the morning rally was news that U.S. incomes actually declined in September, by 0.1%, for the first time since July 2009. The unexpected drop in incomes was accompanied by a smaller than expected increase in consumer spending during the month. An insightful blog today by Annaly Capital Management, titled Government Sponsored Spending, addresses the perplexing rise in spending relative to income. In the most troubling graph (shown below), for the first time in the postwar era, "consumption expenditures are exceeding ex-transfer income." Although this trend could continue for a while, it is far from sustainable and implies that without a commensurate rise in incomes, spending will ultimately need to retract.


   Tomorrow's midterm elections are expected to bring about new changes. Whether or not these changes help spur the economy, reduce unemployment and set the U.S. on a sound fiscal path for the future, only time will tell. However, what is nearly certain is that Republicans will pick up seats in both chambers of Congress, likely taking control of at least the House. Looking back a mere two years, it's remarkable to remember that an anti-Republican/George W. Bush campaign invigorated a Democratic party in a move for change and hope. Now, Republicans are riding an anti-Democratic/government campaign back into power with hopes of reverting policies back to the 'good old days.'

   The stock markets are without doubt optimistic about gridlock, arguing that in the past it has always led to meaningful returns. Just as quickly as America's forgotten its distaste for the Republic party, investors have forgotten the lost decade most recently concluded. Despite efforts to compare the election and economy today to that of 1994 and 2002, there are numerous large issues which will require action. What will come of the Bush tax cuts? Will health care or financial reform be repealed? Will government spending or entitlements be cut? One way or another, these questions and others will be answered, bringing about a new set of policy changes. However, if we are so abruptly unhappy with the desired changes of the '08 election, how can changes desired in 2010 inspire such certainty that they will prove any more fulfilling?

   John Mauldin's article today, Be Careful What You Wish For - Thoughts From The Frontline - InvestorsInsight.com | Financial Intelligence, Advice & Research / Investment Strategies & Planning for Individual Investors., further articulates this view of caution. Although Mauldin highlights a number of worthy points, I'd like to focus on one that has not received significant attention from the general media. Mauldin discusses the potential expiration of extended unemployment benefits on November 30th. Based on his calculations, somewhere around one million Americans could lose unemployment benefits by year's end, with another three to four million being dropped by April. Assuming Republicans gain control of at least the House, is it unreasonable to think these benefits may be left to expire? Even if they are ultimately renewed, it seems easy to imagine any decision being held up for some time during the lame duck session. Considering the graph shown earlier related to spending and income, the sudden reduction in billions of dollars of transfer income would certainly be a drag on consumer spending. Given the U.S. economy still relies heavily on consumer spending, this decision alone could reduce expected GDP growth for several quarters.


  With the election results still unknown, I'll end with a troubling question for the future. The Republicans have seemingly spent the past two years attempting to block most measures proposed by the Democrats. With the economy still struggling they are now poised for significant gains. Let's imagine that the Republicans take the House but Democrats maintain a small advantage in the Senate. Would Republicans grind Congress into a stalemate, pressuring the economy and unemployment, all in hopes of riding the frustration to sweeping control of the White House and Congress in 2012? (Even more concerning...would this move actually be intelligent political strategy?)