Over the past few years it has become increasingly clear that the Federal Reserve and federal government are targeting rising asset prices, rather than incomes, as a way of generating economic growth. A recent post outlined some of the dangers of persistent negative real interest rates:
Households and businesses “with access to cheap borrowing” have been pouring money into stock, bond, housing and commodity markets rather than investing in tangible capital. The remarkable rise in asset prices has unfortunately not funneled down to households in the bottom four quintiles of income and wealth, only furthering the inequality gap.
Cullen Roche addressed a similar issue yesterday in a post on The Fed’s Disequilibrium Effect via Nominal Wealth Targets:
Fed policy and the monetarist perspective on much of this can be highly destabilizing by creating this sort of ponzi effect where asset prices don’t always reflect the fundamentals of the underlying corporations. It’s not a coincidence that we’ve have 30 years of this sort of policy and also experienced the two largest nominal wealth bubbles in American history during this period.
The title of this blog is also not a coincidence, since my formative years encompassed both the dot-com and housing bubbles. My relatively limited experience with financial markets and macroeconomics (based on age) has been punctuated by financial instability. These memories are the driving factor behind my desire to study financial instability and inform policy decisions that can stabilize the business cycle.
In a recent post on The Spinning Top Economy, Matthew Berg helps further my goal with insight on measuring financial instability (my emphasis):
Now we have Government IOUs on the bottom, serving as the base of the economy. Bank and Non-Bank IOUs are leveraged on top of those IOUs – somewhat precariously.
In fact, you can think of the economy as a spinning top rather than a pyramid. Like a spinning top, the more top-heavy the economy becomes, the greater its tendency to instability, and the more readily it will topple over and collapse in a financial crisis.

Now, what happens if, as was the case during the dot-com bubble and the housing bubble, private sector net financial assets go negative but net worth continues to grow?
In fact, the difference between the measures of net financial assets and net worth provides us with a good rule of thumb for how to spot a bubble economy. If private sector net worth is growing at a greater rate than private sector net financial assets are growing, then that means that the economy – symbolized by our spinning top – is growing more top-heavy.
So, what happens if we make the spinning top more top-heavy? You can go ask your nearest Kindergartener – it becomes more likely to topple over.
Since Matthew provides the guidelines for spotting “a bubble economy,” let’s take a look at the empirical data to see how well it aligns with the story. The first chart displays the growth rates of private sector net financial assets (NFAs) and private net worth over the past 20 years*: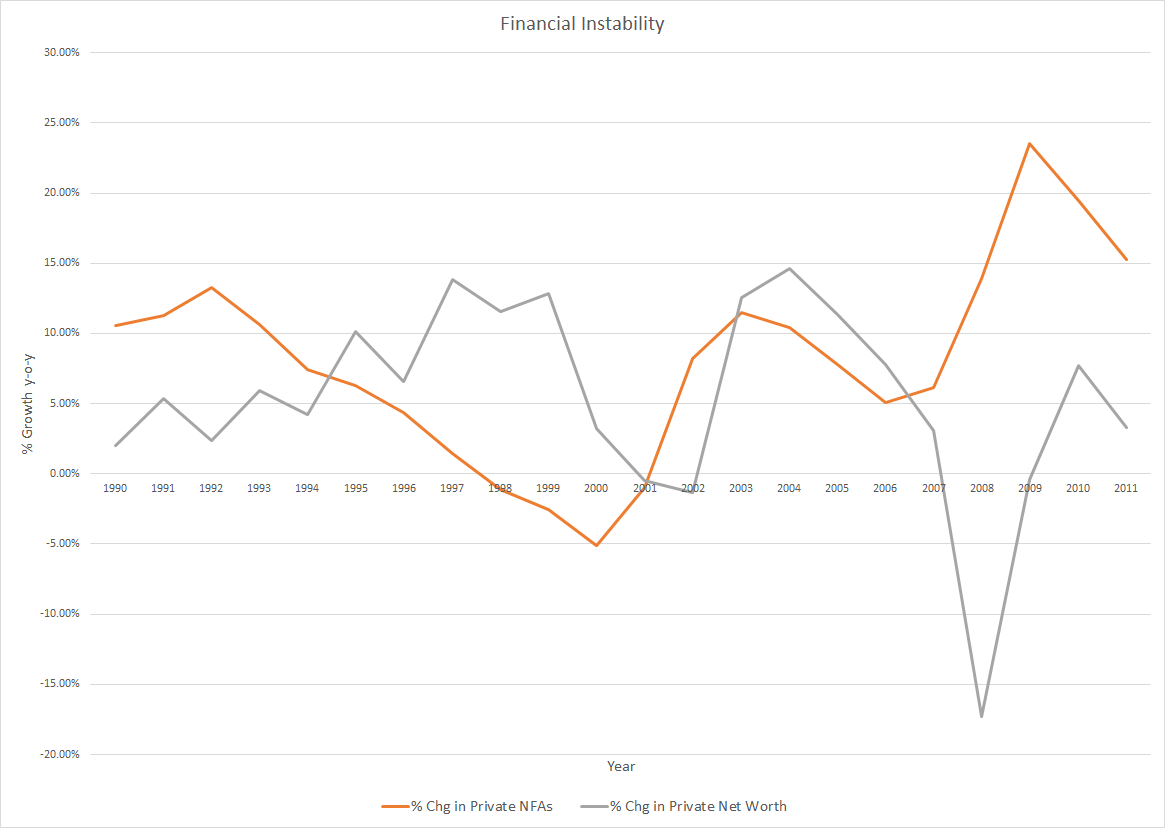
The negative growth rate in private NFAs corresponds with the Clinton surpluses, while the two positive surges are due to the Bush tax cuts and Bush/Obama stimulus measures. Turning to the growth in private net worth, the brief decline stems from the bursting dot-com bubble and the massive drop from cratering house prices. Combining the two measures will show when/if the economy was becoming “top-heavy” (first chart displays the past 50 years; second chart is the same data but only the past 20 years, for clarity):
Past 50 Years
Past 20 Years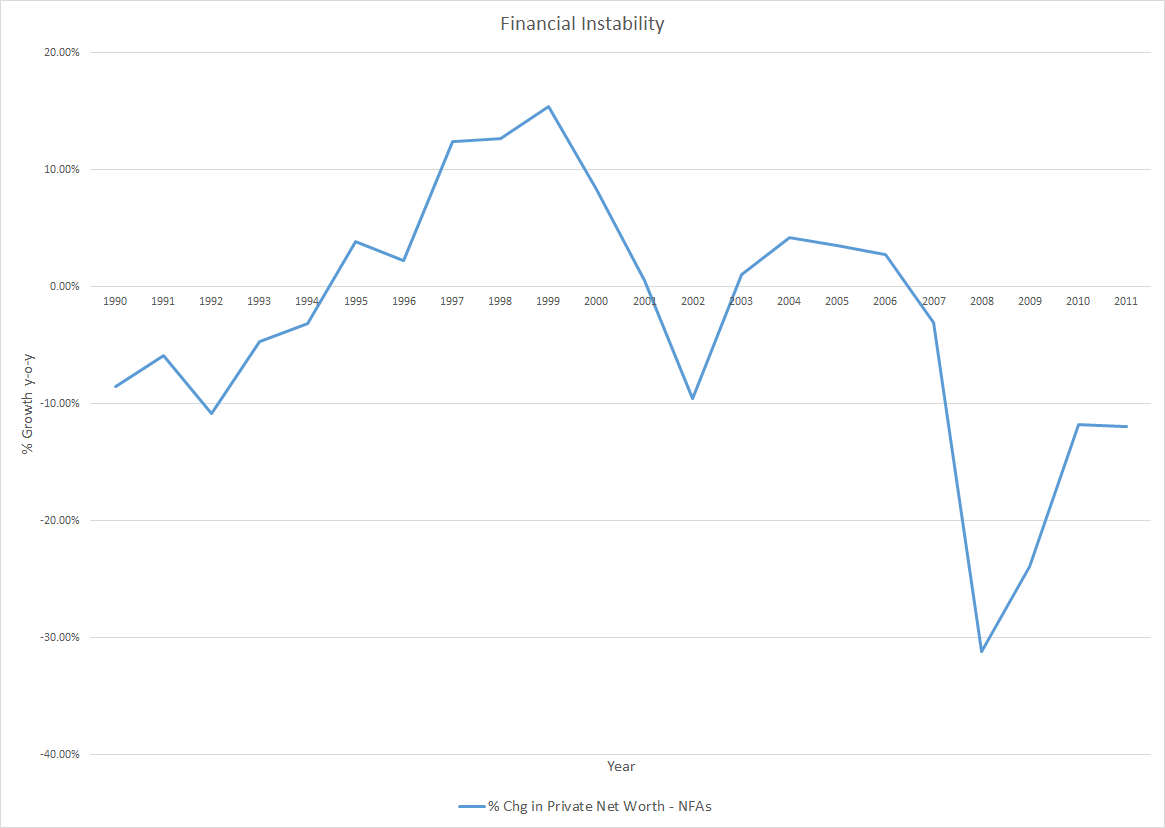
Growth of private net worth began outpacing the growth of private NFAs in 1995 for the first time since 1979. The difference in growth rates then remained positive for 10 of the next 11 years. This streak is truly remarkable given that prior to 1995, the difference had only been positive in five other years dating back to 1961.** At the end of 2006, the U.S. economy was clearly more “top-heavy” than any previous time in the post-war era.
Over the past three decades, growth in private debt exceeding income and declining nominal interest rates have generated enormous returns for asset holders. Throughout the 1980’s and early 1990’s, federal deficits provided more than enough NFAs to keep pace with rising private net worth. Then, in 1995, deficits began decreasing just as the growth of net worth (and private debt-to-GDP) began accelerating higher. The unsurprising result has been more than a decade of meager asset returns, subpar economic growth and high unemployment.
The government policy of targeting nominal wealth, driven by an expansion of private debt, has failed not only at increasing net worth but also, and more importantly, at creating sustainable growth in output and employment. Going forward the focus of policy must return to promoting the growth of income and assets, which in turn will fuel higher output, employment and ultimately wealth.
*Data for private net worth comes from the Federal Reserve’s Flow of Funds Accounts of the United States (Z.1). Data for private net financial assets (NFAs) comes from the National Income and Product Accounts (NIPA) at the BEA.
**Aside from 1979, growth of private net worth exceeded the growth of private NFAs in 1961, 1965, 1969 and 1978 (0.05%).
Related posts:
The Rise of Debt, Interest, and Inequality
Fear of Bubbles, Not Inflation, Returns to the Fed
Why the Federal Reserve Mandate Means That Bernanke Doesn't Have to Worry About Bubbles
Earlier this week I discussed the dangers of misunderstanding “helicopter money” and higher inflation targets. A focus of that post was the incentives stemming from negative real interest rates that will lead to greater investment in real assets, not businesses. The obvious implication is that negative real interest rates entail significant risk of spurring asset bubbles.
This discussion of asset bubbles comes on the heels of St. Louis Federal Reserve Governor Jeremy Stein’s speech that suggested the Fed was becoming increasingly concerned about bubbles, not inflation. According to a recent Bloomberg article, apparently Fed Chairman Bernanke was not onboard with the supposed shift (h/t Tim Duy):
Federal Reserve Chairman Ben S. Bernanke minimized concerns that the central bank’s easy monetary policy has spawned economically-risky asset bubbles in comments at a meeting with dealers and investors this month, according to three people with knowledge of the discussions.
Do Bernanke’s comments imply the change Stein alluded to is not really happening? Not necessarily. To understand why, one must consider the goals assigned to Bernanke or any Fed Chairman for that matter. The following is from Chapter 2 of the Federal Reserve System’s own publication, Purposes & Functions:
The goals of monetary policy are spelled out in the Federal Reserve Act, which specifies that the Board of Governors and the Federal Open Market Committee should seek “to promote effectively the goals of maximum employment, stable prices, and moderate long-term interest rates.”
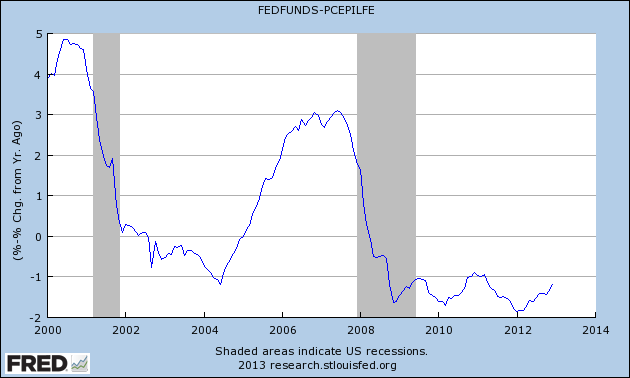
Although no explicit mention of preventing asset bubbles is made, the goal of stable prices leaves the door open for such an interpretation. Before addressing the Fed’s own interpretation of stable prices, its worth discussing the specific types of assets that are seemingly most prone to bubbles. The three major categories are commodities (e.g. oil, copper, sugar), financial assets (e.g. stocks and bonds), and housing. During the past decade real interest rates have actually been negative more often than not (Real Interest Rate = Effective Fed Funds rate - core PCE):
Unsurprisingly the past decade has also witnessed asset bubbles in commodities, stocks and housing:
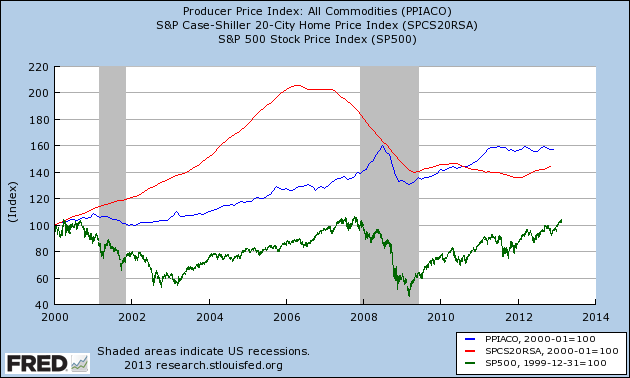
Prices of these assets have clearly been anything but stable. So has the Fed failed in that aspect of its mandate? The answer is a resounding “NO.”
To remedy the cognitive dissonance readers may be experiencing, consider how the aforementioned real assets affect the FOMC’s preferred inflation measure, core Personal Consumption Expenditures (PCE). Financial assets are noteworthy in their distinct omission from the type of products making up PCE. Commodities are included in the general price measure, however core PCE is calculated by excluding a couple of the more volatile commodity components: food and energy. Housing is actually included in core PCE but is calculated using the space rent of nonfarm owner-occupied homes, not actual house prices. Focusing on core PCE thereby removes any direct concern with asset bubbles.
Bernanke has already announced his plans to step down as Fed Chairman early next year (2014). Given the Fed’s stated mandate and preferred measure of prices, it is no wonder that Bernanke is unconcerned with asset bubbles. The goals of his chair are to maximize employment and maintain stable prices. Since the types of assets prone to bubbling are not included in core PCE and appear relatively uncorrelated with that measure, to the degree that bubbles can benefit employment in the short run, they may actually be desirable.*
These institutional incentives of a Fed Chairman are unfortunately at odds with the country’s longer term economic goals. Asset bubbles created by excessive lending and/or negative real interest rates are always followed by busts. These busts are simply the recognition of malinvestment that already took place during the boom. If the booms are financed with significant leverage, the resulting deleveraging may lead to a debt deflationary spiral. Whether or not that’s the case, though it usually is, malinvestment suppresses both employment and economic growth over time.
One can argue over whether Bernanke’s views on the effectiveness of monetary policy are correct or not, but his decision to ignore asset bubbles is perfectly rational given the circumstances. Shifting the Fed’s focus from inflation to bubbles will therefore require changing the institutional incentives.
*The three major asset categories mentioned above presumably will have very different effects on employment. Among the three, commodity bubbles are least desirable from an employment perspective. Higher commodity prices generally hurt consumer spending, which may lead to a temporary decline in employment. Housing bubbles are the most desirable in these terms since the increased demand can generate a temporary employment boom in construction and housing-related services.
Ashwin Parameswaran has a fantastic post today explaining why Helicopter Money Is Not Dangerous, All Macroeconomic Policy Is Dangerous “in the sense that irresponsible implementation can lead to macroeconomic chaos.” Before jumping into the main attraction of the post, I want to briefly clarify a general discrepancy regarding what helicopter money actually entails.
More than forty years ago, Milton Friedman famously quipped that price deflation can be fought by "dropping money out of a helicopter."[37] Friedman was referring to central bank policy and, to this day, a “helicopter drop” is typically associated with monetary policies, such as quantitative easing (QE). This is an unfortunate interpretation of monetary policy since most central banks, including the Federal Reserve, are as equally unable to actually implement a “helicopter drop” today as they were back in 1969. Willem Buiter clarifies how the policy could realistically be implemented in a paper on “Helicopter Money” (equations omitted):
Technically, if the Central Bank could make transfer payments to the private sector, the entire (real-time) Friedmanian helicopter money drop could be implemented by the Central Bank without Treasury assistance.
…
The legality of such an implementation of the helicopter drop of money by the Central Bank on its own would be doubtful in most countries with clearly drawn boundaries between the Central Bank and the Treasury. The Central Bank would be undertaking an overtly fiscal act, something which is normally the exclusive province of the Treasury.47
An economically equivalent (albeit less entertaining) implementation of the helicopter drop of money would be a tax cut (or a transfer payment) implemented by the Treasury, financed through the sale of Treasury debt to the Central Bank, which would then monetise the transaction. If the direct sale of Treasury debt to the Central Bank (or direct Central Bank lending to the Treasury) is prohibited (as it is for the countries that belong to the Euro area), the monetisation of the tax cut could be accomplished by the Treasury financing the tax through the sale of Treasury debt to the domestic private sector (or overseas), with the Central Bank purchasing that same amount of non-monetary interest bearing debt in the secondary market, thus expanding the base money supply. (2004: p. 59-60)
One might inquire whether changing to a “permanent floor” monetary policy regime alters the necessity of monetisation. Apparently prepared for such a future outcome, Buiter says:
This difference between the effects of monetising a government deficit and financing it by issuing non-monetary debt persists even if the interest rates on base money and on non-monetary debt are the same (say zero), now and in the future. When both money and bonds bear a zero nominal interest rate, there remains a key difference between them: the principal of the bonds is redeemable, the principal of base money is not. (2004: p. 10)
Although monetisation may be necessary to achieve the full effect of “helicopter money,” this practice does not alter the dangers associated with the Treasury’s actions. As Ashwin points out:
Whether they are monetised or not, excessive fiscal deficits are inflationary.
On the topic of inflation, I have recently been engaging in a debate with Mike Sax (see here and here) about the potential benefits of targeting a higher inflation rate. This policy has garnered support from both sides of the political and economic aisle (New Keynesians and Monetarists), yet I think its potential benefits are being extremely oversold. My two basic arguments against such a policy are the following:
1) Higher inflation does not necessarily entail higher nominal wages (which many people clearly assume).
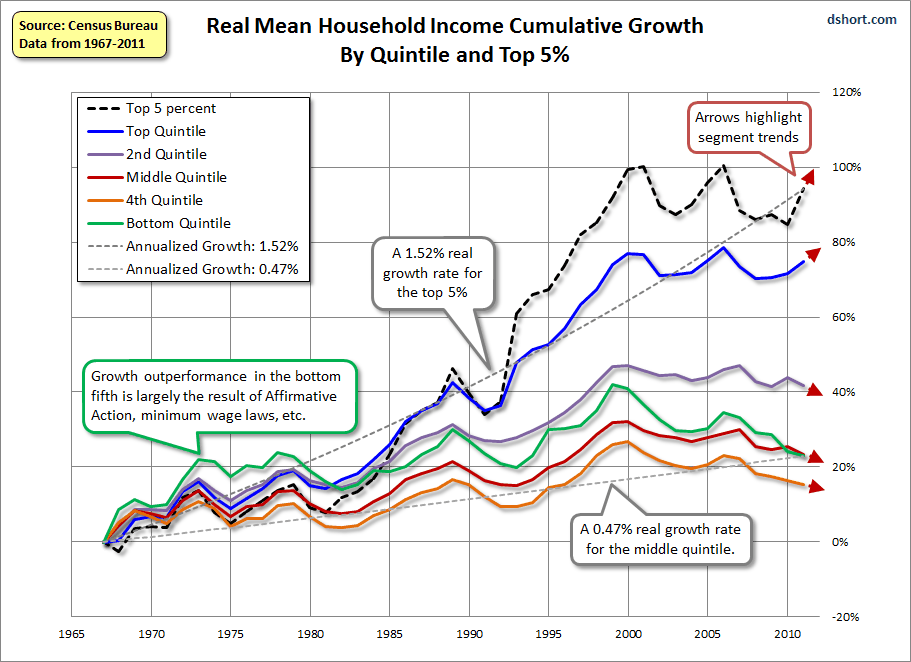
Aside from the top quintile of households, real income has been declining for nearly 15 years. The only way higher inflation helps reduce real debt burdens is if nominal wages increase faster than nominal interest rates on debt. If instead higher inflation stems primarily from higher costs-of living (nominal food and energy prices), than most Americans may find themselves in the precarious position of requiring even more debt to maintain current living standards.
2) Higher inflation alters saving, investment and consumption decisions which can lead to a misallocation of capital. On this second point is where Ashwin’s post really hits home:
During most significant hyperinflations throughout history, the catastrophic phase where money loses all value has been triggered by the central bank’s enforcement of highly negative real interest rates which encourages the rich and the well-connected to borrow at negative real rates and invest in real assets. The most famous example was the Weimar hyperinflation in Germany in the 1920s during which the central bank allowed banks and industrialists to borrow from it at as low an interest rate of 5% when inflation was well above 100%. The same phenomenon repeated itself during the hyperinflation in Zimbabwe during the last decade (For details on both, see my post ‘Hyperinflation, Deficits and Real Interest Rates’).
This also highlights the danger in simply enforcing a higher inflation target without taking the level of real interest rates into account. For example, if the Bank of England decided to target an inflation rate of 6% with the bank rates remaining at 0.50%, the risk of an inflationary spiral will increase dramatically as more and more private actors are tempted to borrow at a negative real rate and invest in real assets. Large negative real rates rarely incentivise those with access to cheap borrowing to invest in businesses. After all, why bother with building a business when borrowing and buying a house can make you rich? Moreover, just as was the case during the Weimar hyperinflation, it is only the rich and the well-connected crony capitalists and banks who benefit during such an episode. If the “danger” from macroeconomic policy is defined as the possibility of a rapid and spiralling loss of value in money, then negative real rates are far more dangerous than helicopter money.
These pernicious traits of higher inflation and especially negative real interest rates are entirely compatible with recent experience. Households and businesses “with access to cheap borrowing” have been pouring money into stock, bond, housing and commodity markets rather than investing in tangible capital. The remarkable rise in asset prices has unfortunately not funneled down to households in the bottom four quintiles of income and wealth, only furthering the inequality gap. Recognition of these effects is precisely why a Federal Reserve fearing bubbles, not inflation, would be a significant step in the right direction.
To be clear, similar to Ashwin, I am in favor of “helicopter money” and believe higher wages for the bottom 80 percent are key to ending the balance sheet recession as well as ensuring more sustainable growth and unemployment going forward. Targeting higher inflation and larger negative real interest rates is the wrong approach to achieve these goals and may actually work in the opposite direction. Yes, all macroeconomic policy is dangerous. But even more dangerous is misunderstood and misrepresented macroeconomic policy.
Bibliography
Buiter, Willem H., Helicopter Money: Irredeemable Fiat Money and the Liquidity Trap (December 2003). NBER Working Paper No. w10163. Available at SSRN: http://ssrn.com/abstract=478673
1) Buffett’s Favorite Valuation Metric Surges Over the 100% Level by Cullen Roche @ Pragmatic Capitalism
For the first time since the recovery began, Warren Buffett’s favorite valuation metric has breached the 100% level. That, of course, is the Wilshire 5,000 total market cap index relative to GNP. See the chart below for historical reference.
I only point this out because it’s a rather unusual occurrence and the recent move has been fairly sizable. It happened during the stock market bubble of the late 90′s, but then occurred again just briefly during the 2006-2007 period when the valuation broke the 100% range in Q3 2006 and stayed above that range for about a year. We all know what followed the 2007 peak in stock prices.
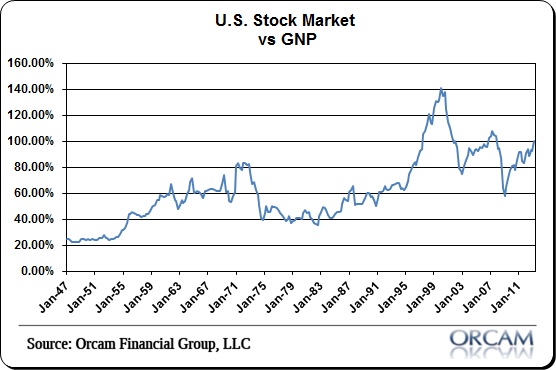
Woj’s Thoughts - These days it’s becoming increasingly tough to find stock market indicators that are not either approaching all-time highs or levels that have only been reached just prior to the onset of a bear market. As shown by the previous two market peaks, clearly this measure can go higher still. Nevertheless, this metric supports the view that the current bull market is much closer to the end than the beginning.
2) A Future of Low Returns? by Timothy Taylor @ Conversable Economist
Here's a figure showing U.S. experience in the long run. The bars on the far right show how annual returns on equity have outstripped those for bonds and for bills from 1900-2012. The middle bars show a similar pattern, a bit less extreme, for the last half-century from 1963-2012. The bars on the far right show the 21st century experience from 2000-2012. Stocks have offered almost no return at all; neither have bills. Bonds have done fairly well, given the steady fall in interest rates, but as interest rates have headed toward zero, the gains from bonds seem sure to diminish, too.
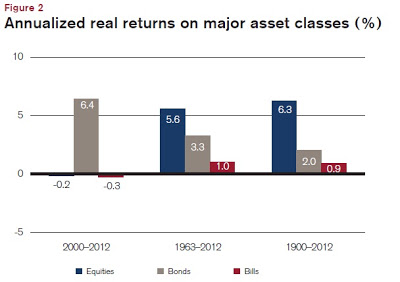
Dimson, Marsh, and Staunton have some grim news for those waiting for a bounceback to 20th century levels of returns: "[M]any investors seem to be in denial, hoping markets will soon revert to “normal.” Target returns are too high, and many asset managers still state that their long-run performance objective is to beat inflation by 6%, 7%, or even 8%. Such aims are unrealistic in today’s low-return world. ... The high equity returns of the second half of the 20th century were not normal; nor were the high bond returns of the last 30 years; and nor was the high real interest rate since 1980. While these periods may have conditioned our expectations, they were exceptional."
Woj’s Thoughts - Most people are probably aware that equity returns have been dismal, so far, during the 21st century. What I find striking is how small the gap between equities and bonds has been over the past fifty years. Sure 2.3% in real terms is significant, especially over a long-time horizon, but given the severely different levels of risk shouldn’t this figure be higher? For those interested in many other great charts and more in-depth discussion, check out the Credit Suisse Global Investment Returns Yearbook 2013.
St. Louis Federal Reserve Governor Jeremy Stein recently gave a speech titled "Overheating in Credit Markets: Origins, Measurement, and Policy Responses."
Carola Binder was struck by the historical relevance of the chosen terminology and offered the following comment in a post on Overheating and the Fed:
In the New York Times, Binyamin Applebaum writes that Stein's speech "underscored that the Fed increasingly regards bubbles, rather than inflation, as the most likely negative consequence of its efforts to reduce unemployment by stimulating growth." In fact, the Fed's concern about bubbles is not so new. After the Great Depression, it was widely believed that the stock market overheated in the 1920s, leading to the Great Crash in 1929 and the onset of the Depression. In those days, the word for bubbles or overheating was speculation, and it became a dirty word indeed. After the Great Depression, speculation remained a major concern of the Fed. The Fed very explicitly regarded bubbles as the most likely negative consequence of its efforts to reduce unemployment by stimulating growth.
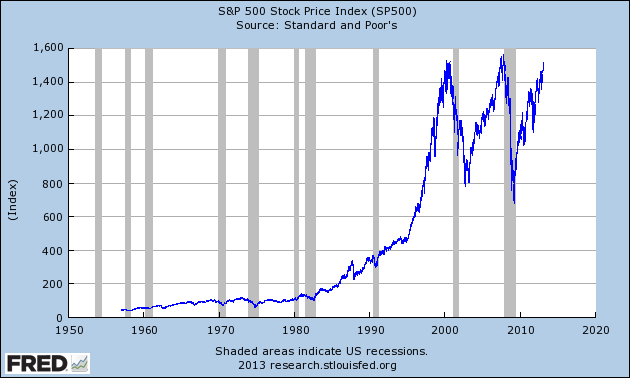
Apparently the Fed has come full circle. Carola goes on to provide a couple excerpts from FOMC minutes during the 1950’s, the last time the Federal Reserve was concerned with asset bubbles instead of inflation. The subsequent change in thought is not overly surprising given that stock markets flatlined starting in the mid-1960’s, as inflation picked up and became a major cause for concern throughout the 1970’s. What is disturbing, is the Federal Reserve’s failure to recognize the changing landscape over the past three decades.
During that time, commercial bank lending has largely shifted its priorities from financing tangible (capital) investment through business loans to financing the purchase of already existing assets (e.g. houses, stocks and bonds):
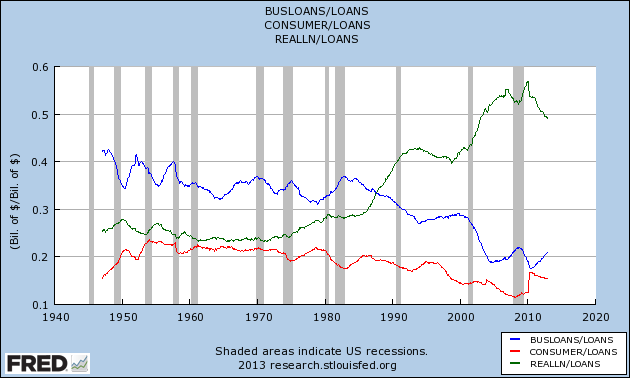
(BUSLOANS = Commercial and Industrial Loans; REALLN = Real Estate Loans; LOANS = Loans and Leases at All Commercial Banks)
It should therefore come as no surprise that the transmission mechanism of monetary policy is now primarily through various asset markets (i.e. real estate monetary standard).
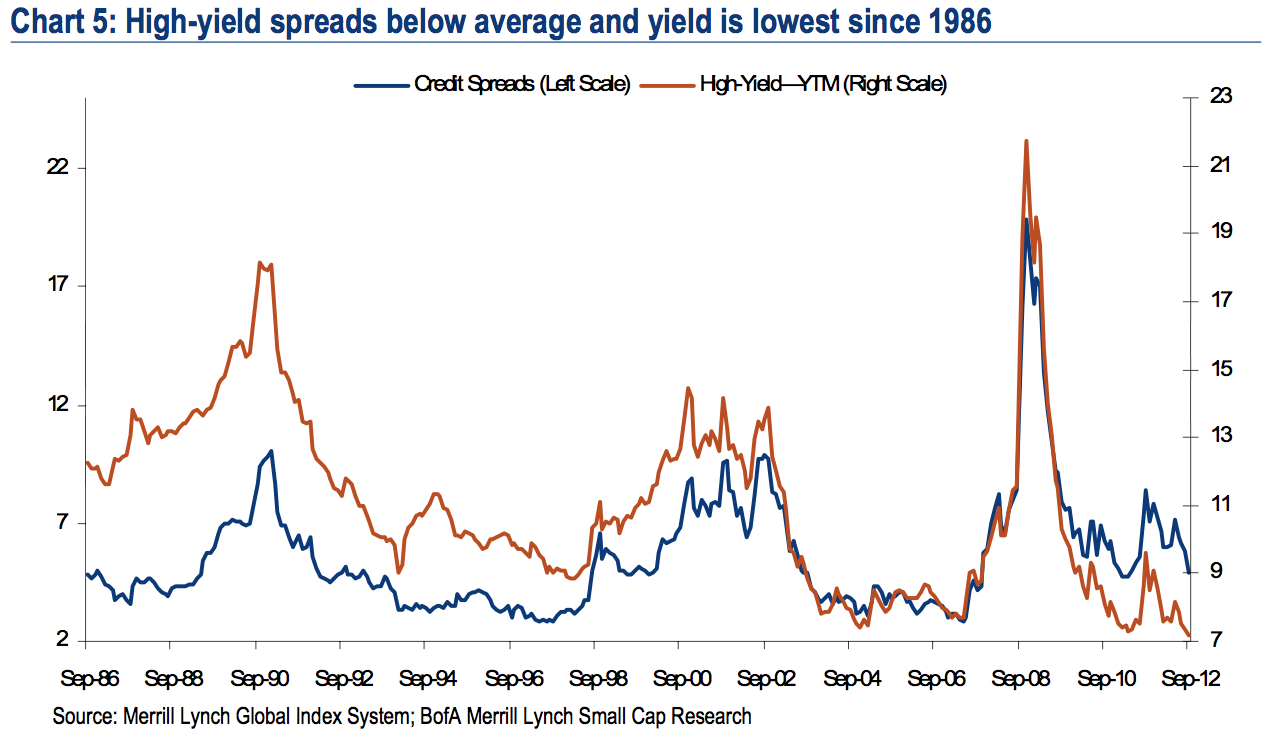
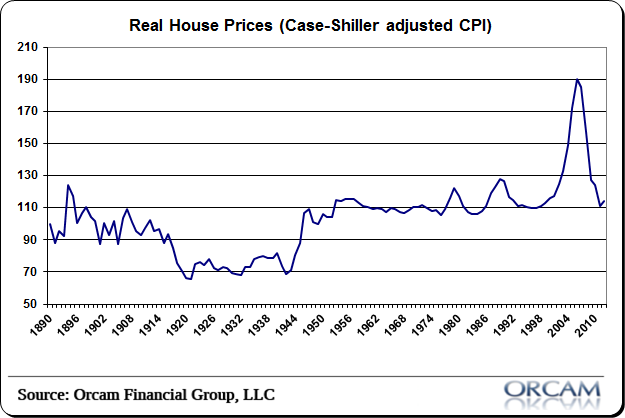
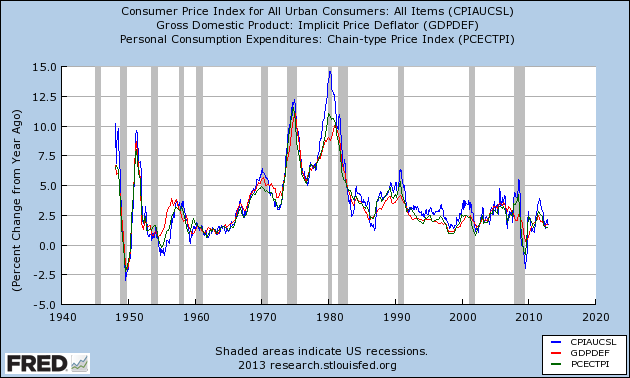
Consider the following charts showing various asset prices and inflation rates during the past 30 years:
Stocks:
High-Yield Corporate Debt:
Houses:
Inflation:
Over the past few years I’ve been very critical of the Federal Reserve’s actions spanning the last couple decades. One of the primary reasons behind this view was the incessant focus on limiting inflation and utter lack of concern regarding asset bubbles. The present risk of a zero interest rate policy (ZIRP) and QEternity lies mainly in inflating new asset bubbles, not creating excessive measured inflation. If the Fed has finally come back around to this realization, that would certainly be a big step in the right direction.
The beginning of a new year is apparently as good a time as any to start thinking about buying a new home. At the start of 2012 I found myself frequently engaged in discussions about whether or not it was finally the “right” time to buy a house. Mortgages with 30-year fixed rates were being offered around 4% and prices appeared to be stabilizing. Despite the widespread optimism, my conclusion was:
When deciding whether or not to purchase a home, there are certainly a whole host of factors to consider that were not discussed here (family, job security, income, savings/debt, location, etc). The purpose is to provide an alternative perspective to the seemingly common perception that now is the best time to buy and those who fail to act will miss a great opportunity. While I don’t rule out that possibility, I believe the outlook for home prices and mortgage rates suggests this window of opportunity will remain open for a few years. In fact, those who wait may be rewarded with lower mortgage rates and more house for their money. There is no rush to buy a home!
Now with the benefit of hindsight, my judgment appears to have held up relatively well. Although house prices have risen approximately 6 percent in the past year:
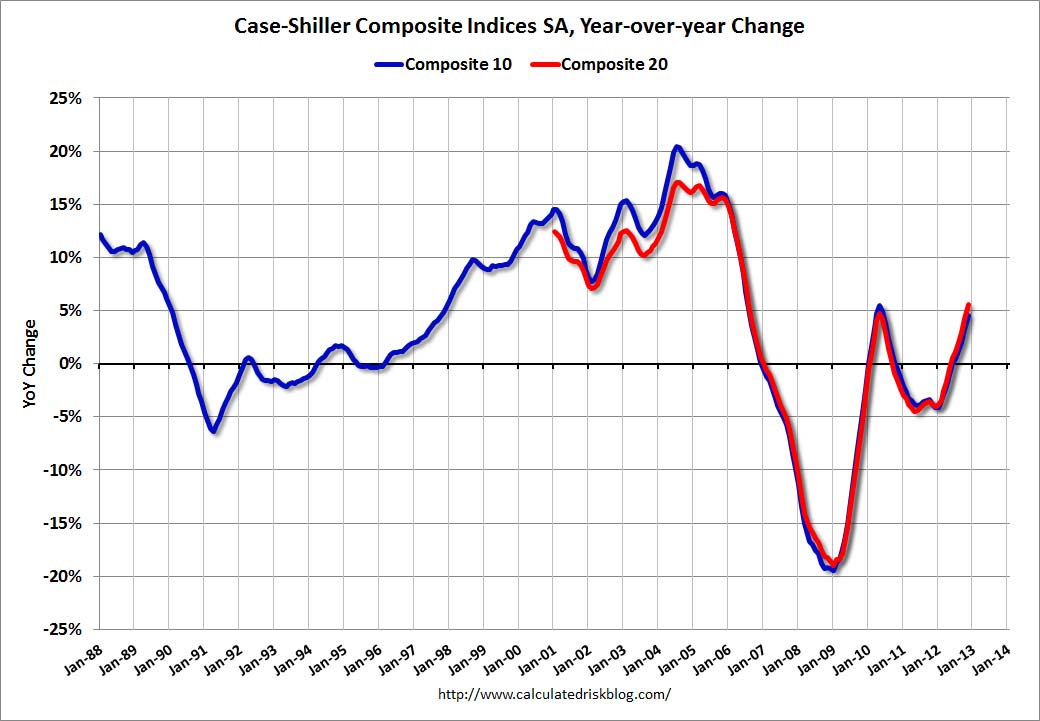
30-year fixed rate mortgages touched a new low of 3.3%: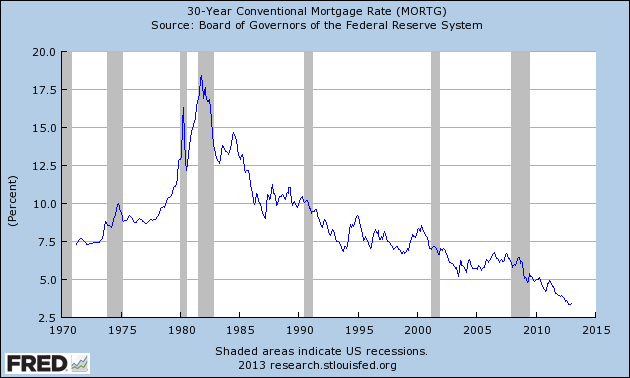 With 2013 only a month old, conversation among friends and family about buying new homes has picked up once again. Oddly enough, the substantial rise in prices over the past year is stoking demand for housing. (I say oddly because basic economics suggests demand should decrease when prices rise) However, before offering my views on future house prices, let me say a few words about mortgage rates.
Over the past few months the FOMC has initiated QE3 (QEternity) and QE4, which involves purchasing $40 billion of Agency-MBS and $45 billion of Treasuries per month. Despite jubilant asset markets, inflation (core-PCE) and GDP growth remain well below 2 percent. This failure to stimulate real growth will likely lead the FOMC to extend its pledge of maintaining interest rates near 0 until at least 2016. Based on this combination of QE, ZIRP, low inflation, and stagnating growth, the chances of mortgage rates rising back above 4 percent anytime soon seems very limited.
Returning to the future direction of house prices, I remain skeptical that household balance sheets have been sufficiently repaired to permit a new debt-led boom. One of the better resources for housing market insights, Dr. Housing Bubble has highlighted the recent surge in investment demand. Meanwhile, Diana Olick discusses reports that Americans are tapping their homes for cash again. Clearly aspects of the previous bubble are returning, which makes it tough to rule out further gains in the short-term. That being said, US residential real estate just isn’t a great investment in real terms and here is Robert Shiller explaining why:
“Housing is traditionally is not viewed as a great investment. It takes maintenance, it depreciates, it goes out of style. All of those are problems. And there’s technical progress in housing. So, the new ones are better….So, why was it considered an investment? That was a fad. That was an idea that took hold in the early 2000′s. And I don’t expect it to come back. Not with the same force. So people might just decide, ‘yeah, I’ll diversify my portfolio. I’ll live in a rental.’ That is a very sensible thing for many people to do.
…From 1890 to 1990 the appreciation in US housing was just about zero. That amazes people, but it shouldn’t be so amazing because the cost of construction and labor has been going down.
…They’re not really an investment vehicle unless you want it for your personal reasons.”
If you want more proof, here is the chart Shiller is referencing: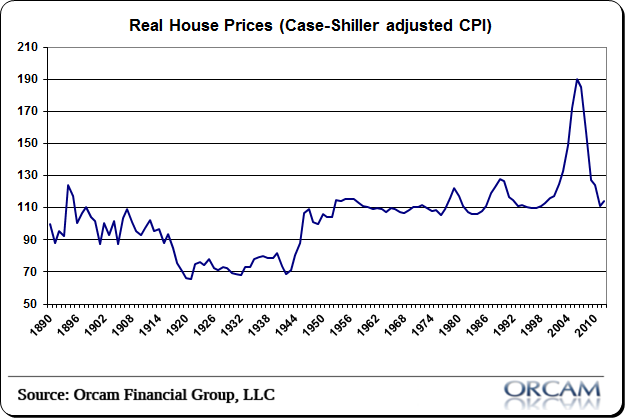
My recommendation therefore remains basically the same as last year. Housing prices and mortgage rates may have bottomed, but the odds of either rising substantially in the next couple years remains small. Ultimately you should buy a house that you want to live in, not that you hope will be a good investment. If you plan on buying, just remember, there is no rush to buy a home!
Last year I took a chance and threw my own projections into the ring. Similar to Byron Wien and Edward Harrison, I mostly selected events that were widely seen as having a low probability (less than 33%) but which I believed held a greater than 50% chance of occurring. Let’s see how I did...
1) Greece leaves the Euro - As the year progresses the Greek economy continues to contract and unemployment continues to rise, surpassing 50% for youth. This combination of factors offsets attempts to reduce the budget deficit as the country repeatedly misses EU and IMF required targets. Despite potential for further bailouts, the Greek people finally decide the consequences of tied promises outweigh the benefits of remaining in the Euro. Greece defaults on all debts, returning to a heavily depressed drachma.
Result - Wrong (0-1). During 2012, Greece was successful in reducing its budget deficit by 30 percent and staying in the Eurozone. This success was in large part due to further defaults on public debt and another bailout. Unfortunately for the Greek people. the price of these efforts remains extraordinarily high. The economy may have contracted as much as 6.5 percent in 2012, the fifth year of recession, according to forecasts in the 2013 budget. Meanwhile both the general and youth unemployment rates continue to soar, reaching ~27 percent and ~58 percent, respectively. At this point Greece is clearly in the midst of a Depression and showing no signs of recovering anytime soon. Greek tolerance of increasing unemployment and decreasing prosperity remains a surprise, although radical political parties have been gaining support. For now Greece remains in the Eurozone, but a future exit remains likely.
2) Italy and Spain lose access to credit markets - A Greek default raises concerns about the potential for creditors to face actual losses on EU sovereign debt. The ECB’s measured efforts are not strong enough to overcome fear and concern about future growth in Italy and Spain. Deep recessions take hold in both countries, pushing deficits higher.
Result - Wrong (0-2). A Greek default and concerns about the European economy weighed heavily on EU sovereign debt during the first half of the year. By the summer, ten-year bond yields in Spain and Italy were at 7.75 percent and 6.75 percent, respectively, and rising. With the countries at risk of losing access to credit markets, ECB President Mario Draghi came forth with a plan to cap sovereign interest rates using open-ended outright monetary transactions (OMT). Draghi’s threat was enough to generate a 180 degree turn in EU sovereign debt markets, but nowhere near enough to turn around the economies. Italy and Spain both returned to recession this past year, pushing fiscal deficits and unemployment higher. While Italy’s unemployment rate remains closely tied to the EU-wide level of ~11 percent, Spain’s general and youth unemployment rates have quickly caught up to Greece’s levels. Eventually Draghi’s Liquidity Bluff Will Be Called, potentially sooner rather than later as a strengthening euro may reignite the EU crisis.
3) The Eurozone enters recession - Practically the entire Eurozone falls into recession, including the likes of France and Germany. A deteriorating economic outlook causes deficit estimates to be raised across the board, facilitating credit rating downgrades. Agreements for greater austerity fail to stem the tide and other attempts to kick the can down the road are pursued.
Result - Correct (1-2). The euro zone economy contracted 0.2 percent in the second quarter and 0.1 percent in the third, meeting the technical definition of a recession. The fourth quarter drop is looking even worse following recent news that Germany saw output shrink 0.5 per cent between October and December. Although Germany managed to run a slight fiscal surplus, at the expense of growth, Spain’s budget deficit probably exceeded 9 percent for a fourth year in 2012. The first half of the year did witness credit downgrades and austerity agreements, but Draghi’s big kick at the end of summer pushed any further actions into future years.
4) China’s GDP growth falls below 7% - As exports to Europe contract, the busting of China’s housing bubble continues unabated. Expectations for massive monetary easing in Europe and the US, along with fear of flare ups in the Middle East sets a floor under energy and food commodity prices. Monetary easing and fiscal stimulus in China are applied too slowly to prevent growth from slowing below the supposedly necessary 8%. (Note: This will be not be considered a hard-landing, which I deem growth below 5%. That may come in 2013, but for 2012 most economists/analysts will be able to maintain expectations of a soft-landing.)
Result - Wrong (1-3). During the third quarter China’s growth rate slowed to a three-year low of 7.4 percent, but the year-end tally will probably be around 7.7 percent. As growth slowed and housing prices fell early in the year, the government took action to allow a smoother transition between governments. Fiscal stimulus has pushed growth and inflation higher in the last few months, but at the expense of rebalancing the economy toward consumers for future sustainability.
5) Oil prices will spike above $120, finish year below $90 - (Using WTI crude prices, currently ~$102) At some point during the year Iran attempts to block the Strait of Hormuz. Further attempts to overthrow governments in the Middle East, possibly some that only recently gained power, hit the headlines again. Combined with global monetary easing, oil prices will move higher and gasoline will once again hit $4 per gallon in the US. These higher prices will exaggerate the reduction in global demand for other goods and push growth lower. As fears of a global recession take over, oil prices will fall, finishing the year down more than 10%.
Result - Wrong, but close (1-4). Fears about Iran and the Middle East never really materialized this year but that did not prevent a wild ride in oil prices. After rising to over $113 in April, WTI crude prices dropped all the way down to $80 in August (daily price history). A rally in the last week of the year brought the closing price slightly back above $90. Brent crude prices diverged significantly from WTI in 2012, keeping gas prices at the pump high throughout the summer. Gas prices peaked at $3.94, not quite $4, but nevertheless reached a record-high average of $3.62 per gallon.
6) US enters recession in 2nd half - Despite higher 4th quarter GDP in 2011, the lower savings rate and energy prices are unlikely to add much growth in 2012. With Europe contracting and China slowing down more than expected, US exports will take a hit. Extensions of the payroll tax cut and unemployment benefits will help ensure the federal deficit holds above 8%. Housing prices will continue to fall (based on Case-Shiller) causing the savings rate to once again reach 5%. By the end of 2012, the US will be in a recession (although NBER may not confirm this until 2013).
Result - Wrong (1-5). Despite Europe contracting, China slowing down and the federal deficit dropping to 7% (still over $1 trillion), US GDP growth remained positive throughout 2012. After falling to 1.3 percent in the second quarter, annualized GDP growth jumped to 3.1 percent in the third quarter. Although current estimates for fourth quarter GDP are below 1 percent, the US is most likely not in a recession at this time. Partially behind the positive growth was the impact of housing prices rising over 5 percent and the savings rate remaining below 4 percent.
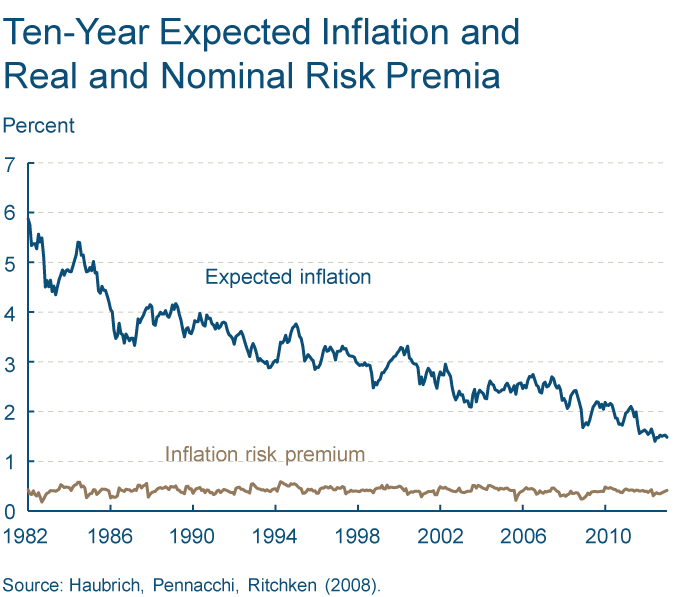
7) Federal Reserve extends forecasts for ~0% rates until 2015 - As growth in the US weakens once again and the global economy slows, expected inflation over the next ten years (based on Cleveland Fed estimates) will fall towards 1%. With unemployment holding steady around 9%, the Fed will move it’s forecasts for the first interest rate hike out to 2015. (Some form of QE3 is also likely, but aside from promoting short-term speculation, the effects on growth are likely to be muted.)
Result - Correct (2-5). Expected inflation over the next ten years fell consistently during the course of the year to approximately 1.5 percent (chart below). Although unemployment improved materially, dropping below 8 percent, the Federal Reserve still felt the urge to step up monetary stimulus. On September 13th, 2012, the FOMC extended its projections for maintaining “exceptionally low levels for the federal funds rate...at least through mid-2015” while enacting a plan to purchase “additional agency mortgage-backed securities at a pace of $40 billion per month” indefinitely. Since QEternity was insufficient to boost growth, the Fed also enacted QE4 to raise the rate of balance sheet expansion.
8) President Obama will win re-election - Generally a weakening economy has been poor for incumbents but this time will be seen as abnormal circumstances. The troubles in Europe and high unemployment will actually spark desire for a more interventionist government. Given the choice between Obama and Romney, the President will win re-election by a slim margin (2% or less).
Result - Correct (3-5). President Obama crushed Romney in the 2012 election based on the electoral college, however the popular vote was decided by less than 3 percent.
9) The US dollar rises over 5% - (Based on dollar index) In spite of QE efforts and another sizable deficit, the US dollar retains its safe haven status. As fears of European defaults spread and China’s slowing growth impacts commodity prices, the dollar will continue to trend higher.
Result - Wrong (3-6). As fears spread about European default and a slowdown in China, the dollar rose several percent into the summer months. When those fears were assuaged by politicians, not economic data, the euro began a strong rally. By the end of the year, the dollar had essentially finished flat.
10) Bonds outperform stocks - The consensus once again favors stocks, although US Treasuries have now outperformed stocks over the past 1, 10 and 30 year horizons. With global growth slowing, inflation expectations will fall. Before this bull market in bonds ends, 10- and 30-year Treasuries may reach 1% and 2%, respectively.
Result - Wrong (3-7). Slowing global growth, falling inflation expectations and stagnating corporate earnings were not enough to deter stocks from a very strong performance in 2012. The Bernanke put morphed into a proactive Fed determined to push asset prices higher and succeeding to the tune of over 15 percent. While stocks were riding towards new highs, the bull market in bonds also remained intact. The 10- and 30-year Treasuries hit their respective lows of 1.43 and 2.46 during the summer before heading higher into year end. Ultimately 10- and 30-year Treasuries last year posted returns of only 3 percent and 2.5 percent, respectively.
That’s the end of it. 3-7 is certainly a bit of a disappointment, especially given the direction of events through the first half of the year. That being said, the logic behind each prediction was sound and far more on target than the end result suggests. My main takeaway is that politicians are far more determined to maintain the status quo than I had expected. The underlying economic (and social) problems have once again been kicked down the road for future governments to handle. As long as that pattern holds, current optimism and modest growth can persist for another couple years.
My hope is to have Predictions for 2013 out by the end of next week. Stay tuned.

