Thursday, July 14, 2011

2011 Mimicking 2007 Market Top

Many posts will focus on macroeconomic data but this is a brief and interesting note about the current US stock market environment. Take a look at the charts which are intriguing. While it remains unclear whether or not the US will fall back into recession in the coming months, GDP for the first half of 2011 is likely to have been sub-2%. Historically, sub-2% year over year GDP gains has been a reasonable forecaster of coming recessions.

From Tony Pallotta of MacroStory.com

How An Equity Market Prices In Recession

Recently I compared the 2007 equity topping pattern to that of the current market.  The premise being today as in 2007 the US economy is quite possibly entering economic recession.  Long gone are the days of equity markets being forward looking as proven in 2007 when they peaked just two months before contraction began.  A similar pattern is also playing out in the 10 year treasury.
I suspect a topping market is more a function of psychology and less technicals or macro data. The money making bull is slowly dying while the bears are eager for their turn to shine.  The result of this clash of views and buying power is dictated more by emotional, whipsawing action where convictions in one's position and volatile price action make coexistence difficult if not impossible.
In the original post the question was "are we forming Point E."  Well it appears Point E has in fact been formed and the pattern continues to play out almost text book.  Some will argue in 2007 we were trading below the 200MA for example but I reiterate topping patterns may be more psychological and less technical in nature.
  • In comparing the two patterns what's most interesting is that "last dash for yield" from Point D to E.
  • In 2007 the SPX traded 117 points or 8.3% higher in 11 days while breaking the downtrend.
  • In 2011 the SPX traded 98 points or 7.8% higher in 14 days while breaking the downtrend.
  • The last piece of the puzzle would be Point F (an appropriate label) where markets attempt once last rally while the macro data finally confirms what many had feared, that this soft patch is anything but "transitory."


Thursday, April 28, 2011

Should there be QE3?

   Many highly regarded economists have been writing blogs today offering their opinions of Federal Reserve Chairman Bernanke's press conference.  Tim Duy, Brad DeLong and Mark Thoma have all come out with the opinion that while Fed forecasts would imply the necessity of further quantitative easing, Bernanke appears to be scared away from action.  Encompassed in their view points, as well as the Fed's outlook, is that core inflation is unlikely to reach even 2 percent in the near future and unemployment is likely to remain higher that ideal for several years.  Therefore, given the Fed's dual mandate of full employment and stable prices, another round of quantitative easing aimed at reducing unemployment is worth the risk of higher inflation.

   If the situation above were definitively true, I would have no reason to argue with any of these economists that are certainly far more intelligent than I.  However, the necessary presumption that each of these economist's makes, is that the Fed is capable of bringing down unemployment through quantitative easing.  QE, as a matter of policy, has primarily provided banks with low interest-bearing reserves in return for various maturities of interest-bearing Treasury bonds.  The primary effect of this policy appears to have been in reducing the risk premium of interest-bearing assets and consequently driving up the prices (down the risk premium) of practically all other asset classes.  Considering well established data on the minimal wealth effect from stock prices, an over-leveraged consumer sector and tight controls on credit, it remains unclear that QE had any meaningful effect of job growth.

   While the official unemployment number has been decreasing, the total number of Americans employed has been relatively stagnant for several years.  Much of the decrease in unemployment has been due to a lower percentage of the population being considered part of the workforce.  Even with QE2, job growth has averaged barely 200,000 jobs per month, not much over the 125,000 to 150,000 needed to simply cover growth in the population.  We must not forget that during this fiscal year, which encompasses all of QE2, the federal government is expected to run a deficit of nearly $1.5 trillion, or close to 10% of GDP.  Economists have often argued that the Fed must step up in response to the federal government cutting back.  Although austerity may be coming to America in the near future (for our sake let's hope it doesn't), it has not yet arrived and a 10% deficit is incredibly stimulative fiscal policy.  How many jobs were created by fiscal policy is also unclear, but I have a feeling President Obama would like to lay claim to a sizable portion of that job growth.

   The question renowned economists therefore should be asking is, "can the Fed have a significant impact on unemployment through QE?"  From my perspective, there are ways in which the Fed could encourage greater employment, however QE in it's current state is not one of them.  Economists' should also consider the unintended consequences of Fed policy aside from core inflation.  To date, the Fed appears very capable of sparking grandiose speculation in financial markets. Yet the Fed has appeared unable to control the specific assets to which that speculation is directed.  I fully agree that another round of QE is unlikely to create surging inflation.  What remains suspect is whether or not it will generate surging oil and food prices.  With wages currently flat-lining in the US, further rises in food and energy costs may incite deflation in other assets, including housing, causing greater economic pain and job losses.

   Limiting the discussion of another round of QE solely to the effects of core inflation and unemployment makes two large assumptions that have not been proven true by recent history.  An honest discussion must consider the potential for ineffectiveness of the part of the Fed in reducing unemployment and the potential for inducing skyrocketing prices outside the realm of official inflation measures.  Although I haven't been the greatest supporter of the Fed or Bernanke during these times, maybe their recognition of these facts has led to the somewhat confusing and contradictory position laid out earlier today. There are many economists and policy makers out there far smarter than I, who can offer greater insight on the merits of QE3. However, I strongly believe that discussion of further action must start with more of an open mind about the potential cause or correlation of past policy with realized events.

Tuesday, April 5, 2011

What is "Normal"?


For anyone following my blog, you've likely recognized the significant slow down in the number of posts recently. The drop off has not been due to a lack of ideas, but rather to my personal search for a deeper understanding of economics, financial markets and our monetary system. After starting my own blog, with the help of Google reader, I began searching out and reading other economics/financial blogs. Amazed not only by the sheer number but the renowned economists and investors’ blogging, I recognized my knowledge obviously pared in comparison to Nobel Laureates. Although I don't expect to reach that level of knowledge or insight anytime soon (let alone ever), I've taken it upon myself to read and absorb as much knowledge as possible through these blogs and a multitude of books (thanks to my new Kindle). Hopefully this and future posts will prove increasingly valuable and insightful.

Over the past several months, my news sources for economics and financial markets have shifted from CNBC and websites such as TheStreet.com to numerous blogs and books. A primary reason for the shift is the stark contrast between what I view as news that follows the crowd without much insight versus detailed economic and financial analysis by writers willing to buck the trend. Anyone watching basic news channels or CNBC today will hear a great deal of rhetoric from Wall Street and Washington about how the economy is getting back to "normal" (if not there already). Others who follow PIMCO's co-CIOs, Mohamed El-Erian and Bill Gross, will frequently hear discussion of the U.S. economy mired in a "new normal." All this begs the question, what is normal?

Dictionary.com describes normal as conforming to the standard or the common type. So does the economy today represent a normal recovery? As a starting point, we should consider U.S. fiscal and monetary policy. The recession officially ended in June 2009, yet the federal government ran a fiscal deficit over $1 trillion or nearly 9% of GDP in 2010. For 2011, the deficit is expected to be even larger, possibly breaching 10% of GDP. Switching to monetary policy, the Federal Reserve is currently maintaining short-term interest rates at 0-0.25%, a new low for the post World War II era. At the same time, the Fed is moving towards completion of QEII. Since the recession began, the Fed's balance sheet has grown from $800 billion to nearly $2.5 trillion, by purchasing a great deal of securities that hold far greater risk than U.S. Treasuries. A brief look at history makes clear that 10% deficits, zero-interest rates, and quantitative easing are substantially new for the U.S. but are reminiscent of Japanese policy the past two decades. 


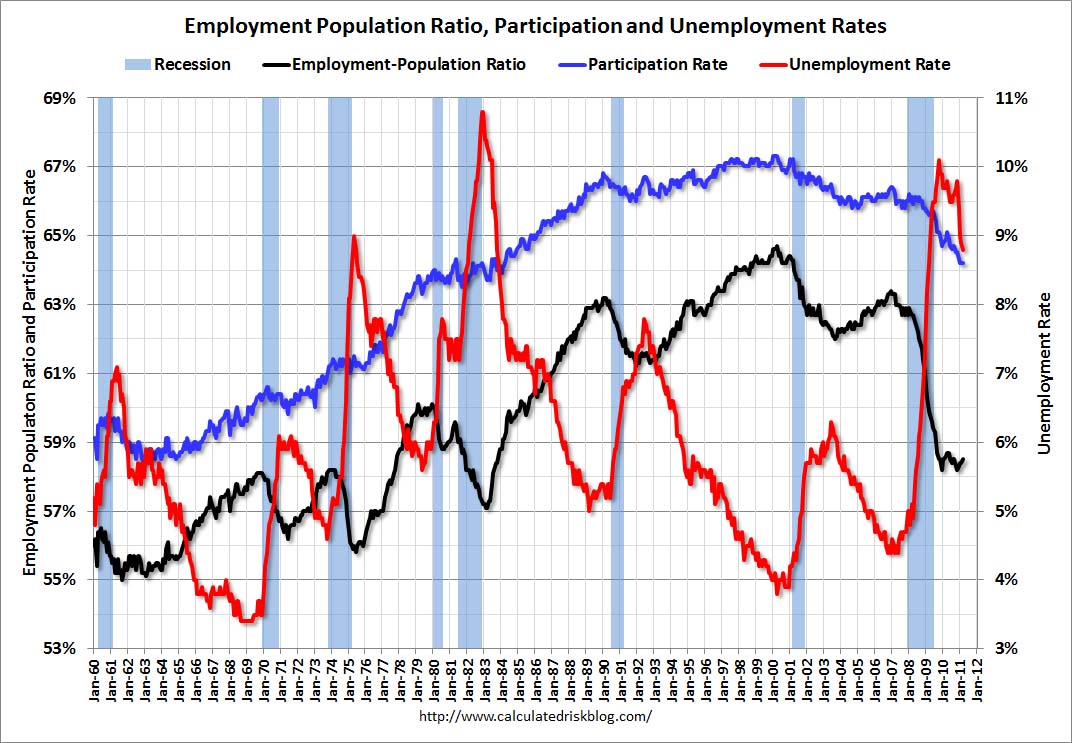
Moving on to employment, U.S unemployment currently stands at 8.8%. This number has been trending lower the past several months with much of the change coming from decreases in the labor participation rate. As depicted by below, the participation rate now sits just above 64% while the employment-population ratio has been fluctuating between 58-59%. Levels this low were last seen in 1983, when the U.S. was recovering from a double-dip recession and the high inflation of the 1970's. Historically, these statistics began trending upward shortly after the recession ended, however nearly two years into the current recovery the statistics are still trending downward. The first quarter of 2010 has seen job growth average nearly 200,000 jobs per month. Even maintaining that pace, it will take the U.S. at least 3 more years to simply recover all the jobs lost during the previous downturn (not including population growth). As a nation we may be becoming more used to high unemployment, however the current situation is far from normal.


Stock markets in the U.S. have been on a tear since bottoming in March of 2009, rising nearly 100% within 2 years. The gains have largely been supported by rapidly increasing corporate profits (as seen below).


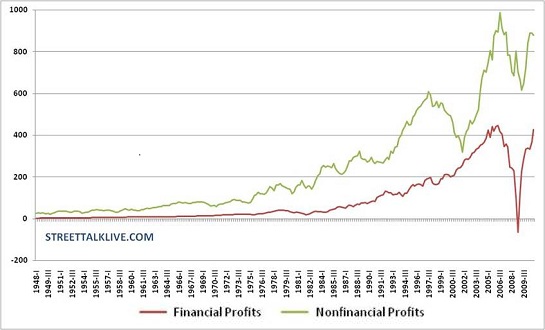
What’s striking about this data is that non-financial profits appear to be topping below their previous peak while financial profits, in the most recent data, have eclipsed previous all-time highs. Many pundits tout soaring financial profits as proof of TARP's success, effects of monetary policy, or simply intelligent bankers. However, considering effects of a ruling by the Financial Accounting Standards Board (FASB) may prove insightful. In early 2009, the FASB updated rule FAS 157, removing mark-to-market requirements for assets where the market is either unsteady or inactive. By removing this requirement, financial firms could revalue large percentages of their assets based on internal valuation models. Many assets types previously facing significant markdowns are lingering in unsteady or inactive markets. Financial firms are likely still holding trillions in assets currently priced based on individual models, including signficant quantities of residential and commercial real estate related assets. As the following chart shows, the value of real estate has moved sideways during the past two years and may be entering a double-dip.


What are the true values of the real estate assets held by financial firms and how does that affect profits? From a purely psycological/capitalist standpoint, we should expect internal values to exceed current market values. Prior to the financial crisis, financial firms had not considered any possibility of real estate values falling nationwide. As the black swan occurres, small percentage declines quickly resulted in cascading losses for many of the firms. Considering the number of mortgages currently underwater and delinquent, it’s unlikely the value of real estate assets has changed much since the relaxation of mark-to-market accounting. This fact has not prevented financial firms from boosting recent profits by reducing loan less reserves or even paying dividends using “excess” capital. Financial firms are even fighting desperately to have capital requirements lowered from the currently proposed 7%.

Why does all this matter? Let’s assume for a moment that the largest financial firms currently hold on average 5% in Tier 1, equity capital. Half of these firms’ assets are also tied up in either unsteady or inactive markets. If these firms were forced to show even a mere 10% loss on their illiquid assets, the losses would wipe out the entire equity base and render the firms insolvent. Back to the real world, some of the largest financial firms likely hold far higher percentages of illiquid assets, currently would be showing much larger than 10% mark-to-market losses, or both. This situation has led some to call many of our current financial firms, “zombies.”

Large federal deficits, extremely accomodative monetary policy, high unemployment and “zombie” banks are clearly not the hallamrk of a typical U.S. recovery. Weakness in state and local budgets, potential for a government shutdown and growing income inequality display further strain below the surface. Looking abroad, revolutions in the Middle East, sovereign debt crises in Europe and the tragic earthquake/tsunami/nuclear effects on Japan are from typical as well. Globally, the political and economic goal appears to be a game of "extend and pretend." While these sherades can continue, potentially for years, the losses will ultimately be recognized.

So is the current recovery/situation in the U.S. “normal”? The answer is most obviously no. A better question is would we want it to be normal? President Obama surged to victory only a few years ago using a campaign based on “change.” Since then, the Republicans have gotten on the bandwagon of representating “change.” Economic recoveries during the past 20 years have been largely jobless. Income disparity in our country has been growing for over 30 years with median real incomes barely budging. Government approval ratings are jokingly low. Maybe it is finally time the U.S. shuns “normal” and seeks change for the better. Making that bold leap requires accepting the current challenges still facing our economy, so that we can comprehensively and accurately address the underlying problems. Only once we accept our current situation and strive for change will the U.S. begin moving again towards displaying its full potential.


Coming Soon: As part of my search for more comprehensive knowledge of economics, I’ve nearly finished reading John Maynard Keynes, The General Theory of Employment, Interest and Money. Needless to say, this brilliant text has provided significant ideas for future pieces and I was especially intrigued by his discussion of financial markets. Some future posts on this topic will be coming soon!


Monday, March 7, 2011

Rising Oil Prices Do Matter

Most Americans have likely noticed the recent sharp rise in gasoline prices. The nationwide average has recently surged above $3.50 per gallon, which is a more than 20% rise in the past month. Crude oil has also spiked higher during the past several weeks, going from the mid-$80's to over $105 per barrel. Recent tensions in the Middle East and, most notably, decreased output from Libya have been the primary drivers behind the soaring prices. A revolution in Bahrain threatens to spread into Saudi Arabia, with potentially drastic consequences for the global supply of oil. Rising prices in oil have begun to affect other asset classes throughout the world and volatility has risen significantly.


Despite the rise in oil prices over the past several weeks, U.S. equity markets remain only a few percent off recent multi-year highs. While several investors, including David Rosenberg, have pointed out the historical correlation between oil prices at this level and forthcoming recessions, many of the large investment banks and media have sought to downplay the effects of higher oil prices. The most common argument against any effect of rising oil prices on consumer spending is fairly simple: Americans have become more used to higher oil prices over the past couple years, making any adjustment in consumption habits less likely. At firth glance, this notion seems reasonable enough. However, upon taking a closer look this concept appears not only faulty but in stark contrast to principles assumed in other markets. 


First, let's consider the basic idea that higher oil/gasoline prices won't lead to reduced personal consumption. In any given month, most consumers income is fairly well known in advance. Typical consumers have a number of core goods they purchase (food, rent/mortgage, transportation) and money left over for discretionary purchases or saving. If the price of gasoline rises 25% and consumption is unaffected, then total spending on gasoline has to increase. For consumer spending on all other items to remain unaffected, Americans must either reduce savings, increase debt or reduce consumption of other goods. Given recent history, expecting consumers to reduce savings or increase debt is certainly not unreasonable, although those practices have generally proved unsustainable. 


The other issue with the argument for disregarding higher oil prices relates to the typical comments made about equity markets by the same firms and media. Over the last decade, U.S. stock markets have experienced two declines of greater than 50% and ultimately ended the decade with zero gains. Although recent history has been poor for equity investors, most analysts today suggest investors ignore recent history and focus on the long-term average gains for U.S. stocks. The Federal Reserve has even been forward in stating that QEII was in part meant to lift assets prices above normal levels, inducing further spending. However, if the principle for oil that rising prices don't affect consumption holds, one has to wonder why rising stock values would trigger increased consumption. Anyone who looks at the price movement in oil and stocks over the past 5 years will notice a strong resemblance. While I can't say definitively whether these price changes will effect consumer choices, it's hard to understand how many proponents of efficient markets could argue for the irrationality of consumers responding in opposite ways to similar effects. 


An entirely separate but nonetheless disturbing argument for the non-effect of rising gas prices on consumption relates to Americans taking public transportation. The basic argument suggests that Americans using public transportation are now saving significantly more money than before. On a fundamental level, savings equals income less expenditures. For a current rider of public transportation, any rise in gas prices that does not affect tolls, will fail to have any effect on the consumer's income or expenses and therefore savings remain unchanged. Although the consumer may experience savings in terms of opportunity cost, the idea that the consumer could use the extra savings to increase spending is off base. 
[Personal anecdote: My freshman roommate in college once told a story about his Dad's trip to Vegas. The father, who was not a big gambler, would decide before the trip that he was willing to lose $1000 gambling. During the trip, the father lost approximately $500. However, when asked how he'd done gambling in Vegas, the father would respond that he won $500. In his eyes, since he'd expected to lose $1000, the fact he only lost $500 was equivalent to winning $500. Regardless of this view, the father did not have $500 more than when he started. In fact, he had $500 less and therefore could not increase spending without adjusting savings, debt or other consumption.]


It's unclear where oil prices will go from here, although tensions in the Middle East should be expected to continue for an extended period of time. The potential for increased fear and speculation to drive prices higher should not be ignored. The concept that a specific level exists at which point global growth will suddenly face significant headwinds seems unlikely. If personal consumption in the U.S. is effected by higher gas prices, downward revisions to future GDP growth may be coming. Given current valuations, caution remains the best investment principle for the time being.

Tuesday, February 22, 2011

1st Quarter Earnings Review: Don't Trust Your Gut

   First quarter earnings season is winding down and as of this evening, all 30 stocks in the Dow have reported earnings for the most recent quarter. Prior to today's large sell-off (largest for the S&P 500 and Nasdaq since Bernanke hinted at QEII) the major markets were all up more than 8% in the first month and half of the year. Much has been made about the strong earnings season, accelerating economic growth and positive tailwinds of fiscal and monetary policy. Based on the rampant bullishness pervasive in the market, it would seem only natural that individual stocks would have reacted positively to their strong earnings reports. Since the market has performed so well, I was curious about individual stock performance and decided to dig for some further information.

   As of Friday's close, 27 of the 30 Dow stocks had reported earnings for their most recent quarter. I decided to look at each stocks individual performance in the first three days after reporting. Calculating the results for one day after reporting earnings, 14 stocks were up and 13 were down. The average move was slightly negative (-0.15%), paced by a more than 7% gain in General Electric (GE) and a 14% loss for Cisco (CSCO). Cumulative returns two days after reporting showed 12 stocks higher and 15 lower, with the average return a bit more negative (-0.36%). Returns worsened again after 3 days of cumulative returns (-0.65%), as only 9 stocks had risen while 18 had dropped. Considering the supposed strength in recent earnings reports, these results were somewhat surprising.

   Knowing how well the entire Dow performed during earnings season, I decided to take the research a step further and calculate the cumulative returns for each stock since three days after reporting earnings. For this metric, the period of time varied significantly, however the results were interesting nonetheless. In the period from three days after reporting earnings until Friday's close, an incredible 25 out of 27 stocks moved higher. The average return was over 3.5%, including significant gains from Bank of America (BAC), Alcoa (AA), Proctor & Gamble (PG) and Boeing (BA), which had each fallen more than 4% in the few days following their earnings reports. There are numerous interpretations of this data but I'll suggest a couple. The market has been expecting good earnings, so actual reports offered a buy the rumor, sell the news opportunity. After a few days, rumors of strong future earnings lifted nearly everyone. A different view might be that individually the earnings stories aren't that great, however expectations for future earnings are substantially positive enough to outweigh recent, backward looking earnings reports. (Interesting note: The remaining three Dow stocks reported earnings today. Home Depot (HD) and Walmart (WMT) both reported during pre-market hours and finished the session lower. Hewlett Packard (HPQ) reported after the close and was down nearly 8% at last check.)

   As today's market showed, a couple weeks of gains can be lost in a day. An interesting look at the best yearly starts in stock market history shows nearly all gains being given back in the first quarter before almost always moving higher toward the year end. Will this year be the same? Revolutions in the Middle East are creating significant headline risk and continue to spark upward pressure on oil prices. Something to consider, rising oil prices act as both a tax on the consumer and have a deflationary effect. As the Middle East consumes the headlines, European sovereign debt has been pushed off the radar. However, Portugal's yields have been moving higher and remain above 7%, the level that forced Greece and Ireland to accept bailouts. Don't be surprised if Portugal is forced to accept a bailout before the month's end. Also, austerity is starting to take hold at state and local levels in the U.S., as witnessed by recent rallies and shutting of schools in Wisconsin. These factors will all likely provide headwinds to the economic recovery and stock market as the year moves along.

   In regards to individual stocks, I recently sold my position in R.R. Donnelley (RRD) after a 20%+ gain. Although it's underperformed the market in the past couple months, I'd still recommend Abbott Labs (ABT) under $47. After today's move, I'd recommend starting positions in Microsoft (MSFT), under $26.70, and Astrazeneca (AZN), below $48.50. If the sell-off continues further, I'd look to add Walmart at $53. These suggestions are meant for investors with a time horizon of at least 2-3 years.


Disclosure: Author has no position in RRD but holds long positions in ABT, AZN, MSFT and WMT.