Most Americans have likely noticed the recent sharp rise in gasoline prices. The nationwide average has recently surged above $3.50 per gallon, which is a more than 20% rise in the past month. Crude oil has also spiked higher during the past several weeks, going from the mid-$80's to over $105 per barrel. Recent tensions in the Middle East and, most notably, decreased output from Libya have been the primary drivers behind the soaring prices. A revolution in Bahrain threatens to spread into Saudi Arabia, with potentially drastic consequences for the global supply of oil. Rising prices in oil have begun to affect other asset classes throughout the world and volatility has risen significantly.
Despite the rise in oil prices over the past several weeks, U.S. equity markets remain only a few percent off recent multi-year highs. While several investors, including David Rosenberg, have pointed out the historical correlation between oil prices at this level and forthcoming recessions, many of the large investment banks and media have sought to downplay the effects of higher oil prices. The most common argument against any effect of rising oil prices on consumer spending is fairly simple: Americans have become more used to higher oil prices over the past couple years, making any adjustment in consumption habits less likely. At firth glance, this notion seems reasonable enough. However, upon taking a closer look this concept appears not only faulty but in stark contrast to principles assumed in other markets.
First, let's consider the basic idea that higher oil/gasoline prices won't lead to reduced personal consumption. In any given month, most consumers income is fairly well known in advance. Typical consumers have a number of core goods they purchase (food, rent/mortgage, transportation) and money left over for discretionary purchases or saving. If the price of gasoline rises 25% and consumption is unaffected, then total spending on gasoline has to increase. For consumer spending on all other items to remain unaffected, Americans must either reduce savings, increase debt or reduce consumption of other goods. Given recent history, expecting consumers to reduce savings or increase debt is certainly not unreasonable, although those practices have generally proved unsustainable.
The other issue with the argument for disregarding higher oil prices relates to the typical comments made about equity markets by the same firms and media. Over the last decade, U.S. stock markets have experienced two declines of greater than 50% and ultimately ended the decade with zero gains. Although recent history has been poor for equity investors, most analysts today suggest investors ignore recent history and focus on the long-term average gains for U.S. stocks. The Federal Reserve has even been forward in stating that QEII was in part meant to lift assets prices above normal levels, inducing further spending. However, if the principle for oil that rising prices don't affect consumption holds, one has to wonder why rising stock values would trigger increased consumption. Anyone who looks at the price movement in oil and stocks over the past 5 years will notice a strong resemblance. While I can't say definitively whether these price changes will effect consumer choices, it's hard to understand how many proponents of efficient markets could argue for the irrationality of consumers responding in opposite ways to similar effects.
An entirely separate but nonetheless disturbing argument for the non-effect of rising gas prices on consumption relates to Americans taking public transportation. The basic argument suggests that Americans using public transportation are now saving significantly more money than before. On a fundamental level, savings equals income less expenditures. For a current rider of public transportation, any rise in gas prices that does not affect tolls, will fail to have any effect on the consumer's income or expenses and therefore savings remain unchanged. Although the consumer may experience savings in terms of opportunity cost, the idea that the consumer could use the extra savings to increase spending is off base.
[Personal anecdote: My freshman roommate in college once told a story about his Dad's trip to Vegas. The father, who was not a big gambler, would decide before the trip that he was willing to lose $1000 gambling. During the trip, the father lost approximately $500. However, when asked how he'd done gambling in Vegas, the father would respond that he won $500. In his eyes, since he'd expected to lose $1000, the fact he only lost $500 was equivalent to winning $500. Regardless of this view, the father did not have $500 more than when he started. In fact, he had $500 less and therefore could not increase spending without adjusting savings, debt or other consumption.]
It's unclear where oil prices will go from here, although tensions in the Middle East should be expected to continue for an extended period of time. The potential for increased fear and speculation to drive prices higher should not be ignored. The concept that a specific level exists at which point global growth will suddenly face significant headwinds seems unlikely. If personal consumption in the U.S. is effected by higher gas prices, downward revisions to future GDP growth may be coming. Given current valuations, caution remains the best investment principle for the time being.
Monday, March 7, 2011


Tuesday, February 22, 2011
1st Quarter Earnings Review: Don't Trust Your Gut
First quarter earnings season is winding down and as of this evening, all 30 stocks in the Dow have reported earnings for the most recent quarter. Prior to today's large sell-off (largest for the S&P 500 and Nasdaq since Bernanke hinted at QEII) the major markets were all up more than 8% in the first month and half of the year. Much has been made about the strong earnings season, accelerating economic growth and positive tailwinds of fiscal and monetary policy. Based on the rampant bullishness pervasive in the market, it would seem only natural that individual stocks would have reacted positively to their strong earnings reports. Since the market has performed so well, I was curious about individual stock performance and decided to dig for some further information.
As of Friday's close, 27 of the 30 Dow stocks had reported earnings for their most recent quarter. I decided to look at each stocks individual performance in the first three days after reporting. Calculating the results for one day after reporting earnings, 14 stocks were up and 13 were down. The average move was slightly negative (-0.15%), paced by a more than 7% gain in General Electric (GE) and a 14% loss for Cisco (CSCO). Cumulative returns two days after reporting showed 12 stocks higher and 15 lower, with the average return a bit more negative (-0.36%). Returns worsened again after 3 days of cumulative returns (-0.65%), as only 9 stocks had risen while 18 had dropped. Considering the supposed strength in recent earnings reports, these results were somewhat surprising.
Knowing how well the entire Dow performed during earnings season, I decided to take the research a step further and calculate the cumulative returns for each stock since three days after reporting earnings. For this metric, the period of time varied significantly, however the results were interesting nonetheless. In the period from three days after reporting earnings until Friday's close, an incredible 25 out of 27 stocks moved higher. The average return was over 3.5%, including significant gains from Bank of America (BAC), Alcoa (AA), Proctor & Gamble (PG) and Boeing (BA), which had each fallen more than 4% in the few days following their earnings reports. There are numerous interpretations of this data but I'll suggest a couple. The market has been expecting good earnings, so actual reports offered a buy the rumor, sell the news opportunity. After a few days, rumors of strong future earnings lifted nearly everyone. A different view might be that individually the earnings stories aren't that great, however expectations for future earnings are substantially positive enough to outweigh recent, backward looking earnings reports. (Interesting note: The remaining three Dow stocks reported earnings today. Home Depot (HD) and Walmart (WMT) both reported during pre-market hours and finished the session lower. Hewlett Packard (HPQ) reported after the close and was down nearly 8% at last check.)
As today's market showed, a couple weeks of gains can be lost in a day. An interesting look at the best yearly starts in stock market history shows nearly all gains being given back in the first quarter before almost always moving higher toward the year end. Will this year be the same? Revolutions in the Middle East are creating significant headline risk and continue to spark upward pressure on oil prices. Something to consider, rising oil prices act as both a tax on the consumer and have a deflationary effect. As the Middle East consumes the headlines, European sovereign debt has been pushed off the radar. However, Portugal's yields have been moving higher and remain above 7%, the level that forced Greece and Ireland to accept bailouts. Don't be surprised if Portugal is forced to accept a bailout before the month's end. Also, austerity is starting to take hold at state and local levels in the U.S., as witnessed by recent rallies and shutting of schools in Wisconsin. These factors will all likely provide headwinds to the economic recovery and stock market as the year moves along.
In regards to individual stocks, I recently sold my position in R.R. Donnelley (RRD) after a 20%+ gain. Although it's underperformed the market in the past couple months, I'd still recommend Abbott Labs (ABT) under $47. After today's move, I'd recommend starting positions in Microsoft (MSFT), under $26.70, and Astrazeneca (AZN), below $48.50. If the sell-off continues further, I'd look to add Walmart at $53. These suggestions are meant for investors with a time horizon of at least 2-3 years.
Disclosure: Author has no position in RRD but holds long positions in ABT, AZN, MSFT and WMT.
As of Friday's close, 27 of the 30 Dow stocks had reported earnings for their most recent quarter. I decided to look at each stocks individual performance in the first three days after reporting. Calculating the results for one day after reporting earnings, 14 stocks were up and 13 were down. The average move was slightly negative (-0.15%), paced by a more than 7% gain in General Electric (GE) and a 14% loss for Cisco (CSCO). Cumulative returns two days after reporting showed 12 stocks higher and 15 lower, with the average return a bit more negative (-0.36%). Returns worsened again after 3 days of cumulative returns (-0.65%), as only 9 stocks had risen while 18 had dropped. Considering the supposed strength in recent earnings reports, these results were somewhat surprising.
Knowing how well the entire Dow performed during earnings season, I decided to take the research a step further and calculate the cumulative returns for each stock since three days after reporting earnings. For this metric, the period of time varied significantly, however the results were interesting nonetheless. In the period from three days after reporting earnings until Friday's close, an incredible 25 out of 27 stocks moved higher. The average return was over 3.5%, including significant gains from Bank of America (BAC), Alcoa (AA), Proctor & Gamble (PG) and Boeing (BA), which had each fallen more than 4% in the few days following their earnings reports. There are numerous interpretations of this data but I'll suggest a couple. The market has been expecting good earnings, so actual reports offered a buy the rumor, sell the news opportunity. After a few days, rumors of strong future earnings lifted nearly everyone. A different view might be that individually the earnings stories aren't that great, however expectations for future earnings are substantially positive enough to outweigh recent, backward looking earnings reports. (Interesting note: The remaining three Dow stocks reported earnings today. Home Depot (HD) and Walmart (WMT) both reported during pre-market hours and finished the session lower. Hewlett Packard (HPQ) reported after the close and was down nearly 8% at last check.)
As today's market showed, a couple weeks of gains can be lost in a day. An interesting look at the best yearly starts in stock market history shows nearly all gains being given back in the first quarter before almost always moving higher toward the year end. Will this year be the same? Revolutions in the Middle East are creating significant headline risk and continue to spark upward pressure on oil prices. Something to consider, rising oil prices act as both a tax on the consumer and have a deflationary effect. As the Middle East consumes the headlines, European sovereign debt has been pushed off the radar. However, Portugal's yields have been moving higher and remain above 7%, the level that forced Greece and Ireland to accept bailouts. Don't be surprised if Portugal is forced to accept a bailout before the month's end. Also, austerity is starting to take hold at state and local levels in the U.S., as witnessed by recent rallies and shutting of schools in Wisconsin. These factors will all likely provide headwinds to the economic recovery and stock market as the year moves along.
In regards to individual stocks, I recently sold my position in R.R. Donnelley (RRD) after a 20%+ gain. Although it's underperformed the market in the past couple months, I'd still recommend Abbott Labs (ABT) under $47. After today's move, I'd recommend starting positions in Microsoft (MSFT), under $26.70, and Astrazeneca (AZN), below $48.50. If the sell-off continues further, I'd look to add Walmart at $53. These suggestions are meant for investors with a time horizon of at least 2-3 years.
Disclosure: Author has no position in RRD but holds long positions in ABT, AZN, MSFT and WMT.
Tuesday, January 25, 2011
Mythbusting Cash
Years ago, the Internet ushered in a new medium for the flow of information, far surpassing any previous modes in size and speed. Today's world can be characterized by overwhelming masses of information that would likely overwhelm even the highest powered computers. Individuals hardly stand a chance at sorting through all the potential news and research on a given topic, leaving individual minds and the general public vulnerable to accepting largely false information. Theories about the effects of cash on companies and markets over the past several months highlights a topic ripe for misdirection. The goal here is to provide a quick overview of a couple common mis-perceptions before offering articles with further depth and insight on the topic.
For many months now, experts, analysts and investors in the media have pushed the idea that investors holding excess cash would eventually succumb to a strong stock market. Finally choosing to invest their saved cash would push markets even higher. At first glance, this seems like a perfectly reasonable expectation and it's likely the simplicity has accounted for the mass purveyance of this notion. However, viewing this principle within the confines of basic market exchanges reveals some gaping holes in the theory. To explain this misconception, imagine that you are an investor considering purchasing one share of IBM (closed at $161.44 today). You place an order to buy one share of IBM at the prevailing market price tomorrow morning. Let's assume that the stock opens at the same price tomorrow morning and a current shareholder elects to sell you a share at $161.44. Having matched a buyer and a seller, the transaction is executed. You receive one share of IBM and pay $161.44, while the seller gives up one share of IBM and receives $161.44. Evident from this basic scenario, total cash in the system does not change, but rather shifts between individuals. Now imagine that the price at which you purchase a share of IBM moves up to $170 or down to $150. Either way, the amount of cash switching hands changes, but the total amount of cash in the system remains the same.
The obvious question in response to this realization is, how does the market move higher? There are many possible answers to this question, but I'll outline a few primary ones. Money flowing out of one asset class and into another (i.e. bonds vs. stocks), can push up one type of asset with an overload of buyers and the other type down with excessive sellers. Another possibility is that total units of an asset decrease, potentially through mergers, buybacks or maturation among other things. As total units decrease, total cash actually increases through the reduction in securities, providing excess cash to push up prices if/when it gets reinvested. Increasing debt or leverage used to purchase securities can also move prices higher as the newly created funds are invested. Over the past two years, mergers and buybacks have increased but so have the number of IPO's, likely maintaining the number of securities available. Most asset classes have been rising together during this period as well. Therefore, a case could be made that growing debt levels and leverage have contributed significantly in pushing stock markets higher. Recent reports suggesting leverage at hedge funds is back near pre-recession peaks supports this conclusion.
The other large misconception related to cash involves the strength and stability of various companies based on their cash levels. For months, pundits have in unison spoke of the record level of cash on corporate balance sheets as a sign of reduced risk and potential future earnings growth. On the count of large sums of cash aiding earnings growth, the potential is certainly present. Firms feeling confident in their business or pressure to raise earnings can use their cash hoards to buy back stock, purchase other companies, increase production or dividends. As described previously, these actions generally lead to higher stock prices. On the other hand, implying that vast amounts of cash on the balance sheet reduces risk, completely ignores one of the biggest factors of risk...debt.
Imagine that two separate friends of yours ask for a $20,000 loan in order to start a new business. The business plans and your trust in each individual are identical. The only differentiating factor between the two proposals is the effective "balance sheet" of the different friends. Friend 1 has $10,000 in cash to his name and $5,000 in debt (mortgage, credit cards, etc.). Friend 2 also has $10,000 in cash, but has racked up $50,000 in total debt. Based solely on the cash held by each friend, it appears the risks to loan re-payment are equivalent. However, considering the stark difference in accumulated debt, it becomes clear that offering the loan to Friend 1 is a significantly better proposition.
Taking this fictitious scenario a step further, let's assume that Friend 2 takes out a $10,000 loan from a bank while awaiting your decision. Friend 2 now has $20,000 in cash and $60,000 in outstanding debt. Based on recent media commentary, Friend 2 is in a better financial position than Friend 1 due to his larger cash holdings. This assumption encourages accumulating greater and greater amounts of debt and masks the risks associated with holding such large sums of debt.
The above example has been used to highlight the misleading portrayal of strength in corporate America, especially of the largest financial institutions. Readily apparent is that without considering the level of debt held by any individual, corporation, state or country, it is practically impossible to accurately determine the credit risk associated in providing loans. A likely reason that pundits have been remiss to comment on the debt or leverage of corporate America, is that size of debt has been rapidly approaching pre-recession levels.
contractionary economic environment. Can we afford to turn a blind eye to accumulation of debt once again? Although cash is unlikely to be the cause of future recessions, it's benefits are currently being wildly mis-portrayed by the general media. For this with a tendency toward risk management, history shows that being wary of debt offers far more insight than levels of cash. Ultimately, news must be viewed with a more skeptical approach, as the sheer volume leaves all of us prone to accepting half or false truths.
Suggested Reading:
"Illusory Prosperity" - Ludwig von Mises on Monetary Policy by John P. Hussman
Monday, January 24, 2011
Bernanke Changes His Tune
Imagine yourself as an investor trying to determine which hedge fund manager is most capable of managing your money. After debating several options you decide upon Mr. Positive who promises stable returns. Mr. Positive outlines the tenets of his fund as seeking to provide returns exceeding those of the S&P 500 with less volatility than the actual index. Halfway through the year, Mr. Positive sends out his mid-year results showing gains of 5% with a volatility slightly above 1 percent per day. These results sound good, but upon reviewing how the benchmark index (S&P 500) has fared over the same period, you learn that the index is up 8% despite volatility below 1% per day. Questioning your decision, you place a call to Mr. Positive and ask why the under performance occurred. Mr. Positive replies that the measures you are reviewing fail to accurately depict the strength of his investment strategy. Mr. Positive explains that during the previous 6 months, assets under management have grown by nearly 20%, showing the true strength of his investment strategy.
If this were a real scenario (which is certainly possible), it would be understandable for an investor to remain upset with their investment decision. Despite Mr. Positive's arguments for remaining positive, the size of assets under management helps the manager but provides little, if anything, for investors. The above situation was outlined not to bash potential hedge fund managers, but rather mimic the curious adjustment in measuring success outlined in recent comments by the Federal Reserve Chairman.
The Federal Reserve currently enjoys the dual mandate of maintaining full employment and stable prices (consistent, reasonably low inflation). As unemployment remained near 10% and inflation (core-CPI, the Fed's preferred measure) stagnated slightly above 0, the Fed decided to embark on a new round of quantitative easing in November. Three months later, the unemployment picture has barely budged and the Fed's measure of inflation and outlook remains below their ideal range of 1.7%-2%. In lieu of this data, the Fed Chairman appears to have changed his tune on how the Fed's efforts should be measured.
In a recent op-ed and interview, Fed Chairman Bernanke argues that the Federal Reserve's policies have been successful, as demonstrated by the greater than 25% rise in U.S. stock markets since announcement of QEII. These statements are especially surprising given their stark contrast with previously established views of the Fed Chairman. For years, Chairman Bernanke has expressed views that the Fed's actions could not be blamed for previous stock market bubbles. Now that Fed policy seems to be driving stock market gains, the Fed Chairman appears very willing to accept the rise as a direct result of the Fed's zero interest rate policy and further quantitative easing.
Using stock markets as a basis for judging Fed policy not only opposes previous Fed views, but extends the misguided view that stock markets and the economy are one-in-the-same. Stock markets have always been and remain a means for companies to acquire cheap funding and investors to gamble on expectations of future corporate profits. A quick glance at history shows these expectations have frequently proved incorrect, creating little correlation between stock markets and GDP growth. Corporate profits, as determined in a free market economy, show no discretion for equitable outcomes and investors have proved able to value the same profits more or less highly at any given time. As witnessed in the most recent recovery, shedding jobs and lowering wages can vastly increase profitability (at least in the short-run). Energy and food prices have also risen dramatically of late, and while these costs have major effects on the majority of consumer spending, they are not counted as official inflation. Under perfectly normal circumstances, it is therefore possible (potentially likely), that the stock market could rise significantly during periods of high unemployment and high inflation (based on total CPI).
If unemployment were to run up above 15% with inflation above 4% a year, would the economy still be considered strong? What if the stock market were still rising? Would the Fed's policies then be viewed as effective? These are the fundamental questions worth considering when assuming stock markets are the best reflection of the true economy and measure of Fed policy success. Is it possible that stock market gains will lead to increased investment and reduced unemployment, as Chairman Bernanke hopes...absolutely. However, history suggests the wealth effect is minimal at best, maybe 4 or 5 cents on the dollar. So we return to the fundamental goals of the Federal Reserve, whose current mandate is to maintain full employment and stable prices. Measuring the results of their policy by any other means is simply misleading.
Monday, January 10, 2011
Rising Yields Prove Less Treacherous for Stocks
In an article today titled The Best Rising Interest Rate Trade, Cullen Roche outlines a recent strategy note published by Credit Suisse. The article is one of many published on the website, Pragmatic Capitalism, which offers interesting new insights on a near daily basis along with links to some of the best pieces from other sources. Anyhow, the strategy outlined describes investing in the Japanese stock market as the best idea in a rising yield environment. Taken from the strategy note, "the rise in real bond yield reflects a rise in growth expectations – and Japan, as the country with highest operational leverage, should benefit from such a rise." Below is a graph and chart from the report depicting the very relationship described and returns during rising yield environments over the past 30 years.
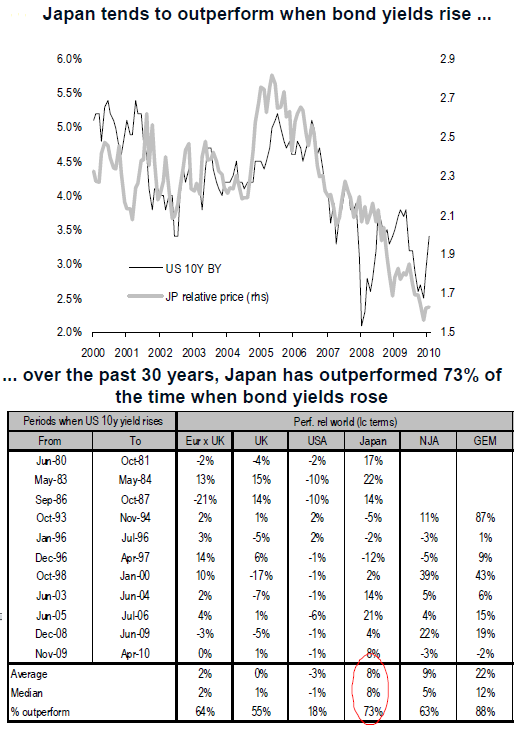
While the average return is certainly impressive, investors would be wise to notice the variation in returns during previous periods. Investors adhering to this strategy between 1993 and 1997 would have found themselves vastly under performing other equity markets around the world. Beyond the above average returns in Japan, the relative under performance of U.S. equity markets noted above is quite striking. During the 11 periods of rising yields over the past 30 years, the U.S. equity market has only increased twice and by a mere 2%. Recently, yields have been rising again and may still be in an upward trend, although they've retreated slightly from the most recent peaks. Therefore, it seems worthwhile to consider how different equity markets have responded during the most recent period of rising yields.
The yield on 10 year treasuries last bottomed on October 8th, 2010 and has since peaked on December 15th, 2010. During that time the benchmark index for the UK, the FTSE 100, rose nearly 4%. The Nikkei 225, Japan's benchmark equity index, gained more than 6.5%, fulfilling the strategy's expectations. However, most surprising is the S&P 500's nearly 6.5% gain in the face of rising yields. Rising yields accompanied by strength in U.S. equity markets clearly breaks away from history. Is this a trend that's likely to continue or a warning sign of a coming correction?
As Credit Suisse describes in their note, the basic investment thesis revolves around rising real yields reflecting improving growth expectations. Previously I've noted that the natural extension of this theory would imply that falling real yields reflect deteriorating growth expectations. Despite this natural extension, falling real yields have been widely heralded over the past year as positive for equity markets and unrelated to growth expectations. If rising yields have now become a positive catalyst for stocks, then it's possible that yields no longer have any reliable effect on equity markets. Another possible explanation is that the Federal Reserve's quantitative easing skews normal market correlations. The Federal Reserve has openly stated it's goal of raising equity markets through its program and therefore the recent trend would be deemed a success, at least in the short-run. A third potential explanation is offered by extreme levels optimism in equity markets leading to gains despite typically negative signals. Under this view, the market likely faces some downside in the near future. Whether or not yields continue to rise may affect the size of any coming correction and ultimately determine if the most recent period is truly an outlier.
While the average return is certainly impressive, investors would be wise to notice the variation in returns during previous periods. Investors adhering to this strategy between 1993 and 1997 would have found themselves vastly under performing other equity markets around the world. Beyond the above average returns in Japan, the relative under performance of U.S. equity markets noted above is quite striking. During the 11 periods of rising yields over the past 30 years, the U.S. equity market has only increased twice and by a mere 2%. Recently, yields have been rising again and may still be in an upward trend, although they've retreated slightly from the most recent peaks. Therefore, it seems worthwhile to consider how different equity markets have responded during the most recent period of rising yields.
The yield on 10 year treasuries last bottomed on October 8th, 2010 and has since peaked on December 15th, 2010. During that time the benchmark index for the UK, the FTSE 100, rose nearly 4%. The Nikkei 225, Japan's benchmark equity index, gained more than 6.5%, fulfilling the strategy's expectations. However, most surprising is the S&P 500's nearly 6.5% gain in the face of rising yields. Rising yields accompanied by strength in U.S. equity markets clearly breaks away from history. Is this a trend that's likely to continue or a warning sign of a coming correction?
As Credit Suisse describes in their note, the basic investment thesis revolves around rising real yields reflecting improving growth expectations. Previously I've noted that the natural extension of this theory would imply that falling real yields reflect deteriorating growth expectations. Despite this natural extension, falling real yields have been widely heralded over the past year as positive for equity markets and unrelated to growth expectations. If rising yields have now become a positive catalyst for stocks, then it's possible that yields no longer have any reliable effect on equity markets. Another possible explanation is that the Federal Reserve's quantitative easing skews normal market correlations. The Federal Reserve has openly stated it's goal of raising equity markets through its program and therefore the recent trend would be deemed a success, at least in the short-run. A third potential explanation is offered by extreme levels optimism in equity markets leading to gains despite typically negative signals. Under this view, the market likely faces some downside in the near future. Whether or not yields continue to rise may affect the size of any coming correction and ultimately determine if the most recent period is truly an outlier.
Subscribe to:
Posts (Atom)