...is from p.96 of Vitaliy Katsenelson’s The Little Book of Sideways Markets: How to Make Money in Markets that Go Nowhere:
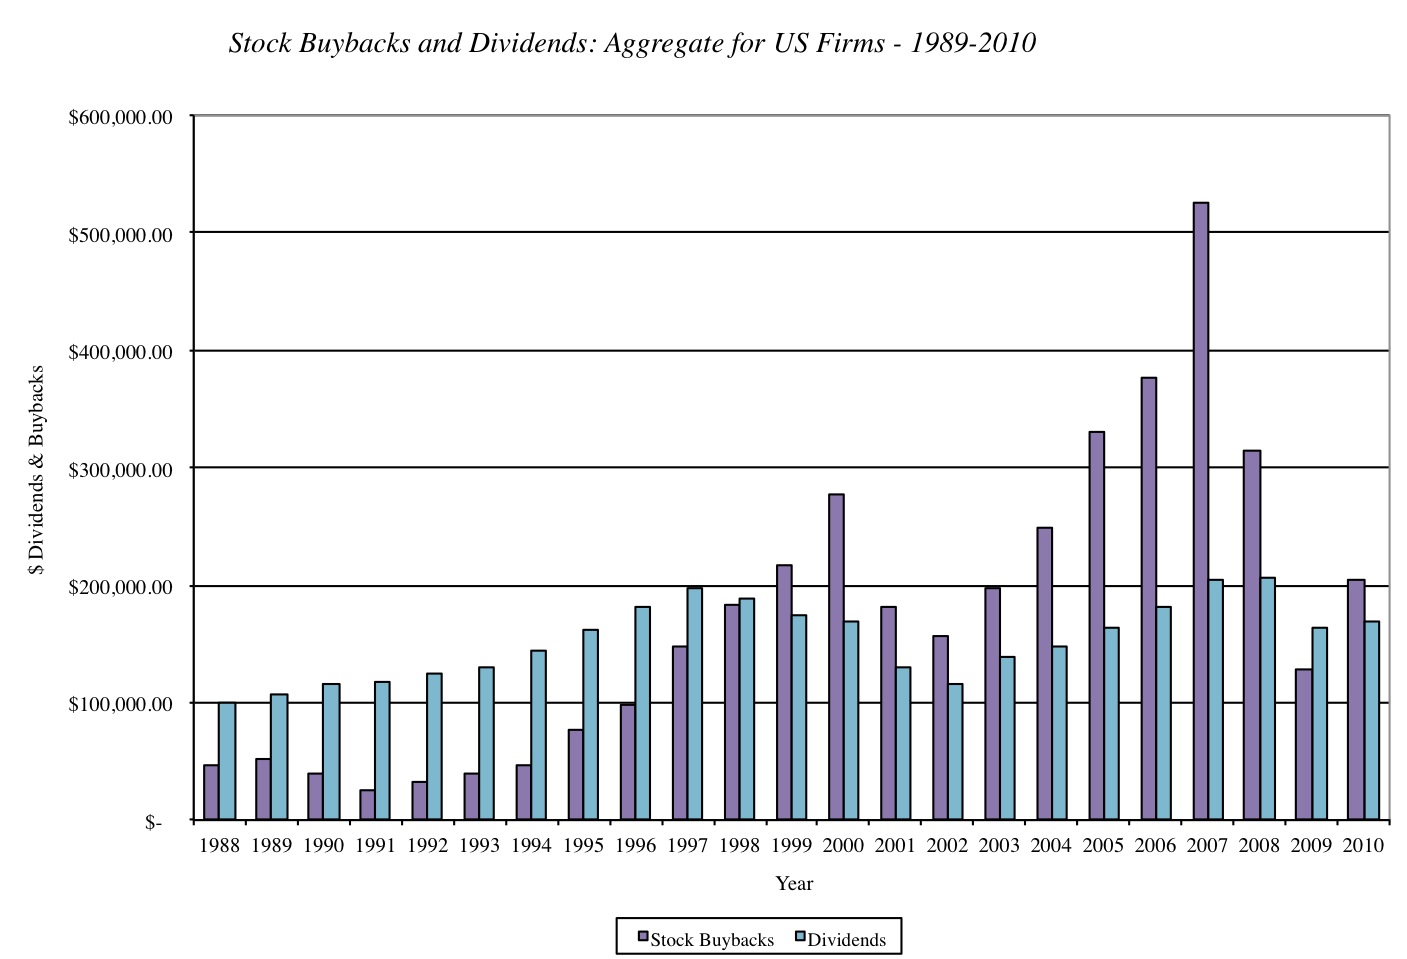
This past week Apple announced plans to buy back up to $10 billion in stock as the company’s shares continue their meteoric rise past $600 from only $80 three years ago. Apple, however, is not alone in ramping up funds to buy back stock at markets repeatedly move higher. The graph below displays total buybacks for US companies over the past 20+ years (from Musings on Markets):
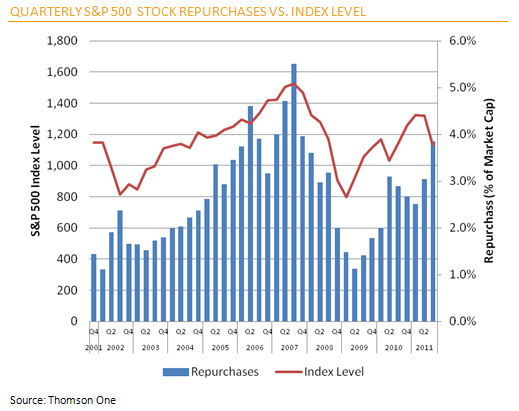
There are two distinct, significant run ups in buybacks: during the late 1990’s and in the middle of the 2000’s. The first peak, in 2000, coincided with the top of the dot-com bubble and the beginning of a lost decade in stock returns. The second peak, in 2007, is also apparent in this next chart depicting the past ten years of stock repurchases with the broad S&P 500 index overlaid on top (from ALPHA NOW):
Once again the peak in stock buybacks (and all-time high) occurred just as the stock market was reaching its all time high. Interestingly, stock buybacks were at their lowest levels in 2002 and 2009, precisely the same time stocks were bottoming.
Since the market’s lows in March 2009, buybacks and the stock market have largely been rising together once again. Analysts and investors frequently celebrate new announcements for buying back stock, seemingly unaware of companies poor historical record of timing the market. Will Apple, among others, choose their timing right this time around? Or will current purchases at new all-time highs destroy value and mark another peak in stocks? History is not on their side.
“Stock buybacks can create shareholder value if the stock is purchased cheaply, but they often destroy value when management overpays for the stock.”
This past week Apple announced plans to buy back up to $10 billion in stock as the company’s shares continue their meteoric rise past $600 from only $80 three years ago. Apple, however, is not alone in ramping up funds to buy back stock at markets repeatedly move higher. The graph below displays total buybacks for US companies over the past 20+ years (from Musings on Markets):
There are two distinct, significant run ups in buybacks: during the late 1990’s and in the middle of the 2000’s. The first peak, in 2000, coincided with the top of the dot-com bubble and the beginning of a lost decade in stock returns. The second peak, in 2007, is also apparent in this next chart depicting the past ten years of stock repurchases with the broad S&P 500 index overlaid on top (from ALPHA NOW):
Once again the peak in stock buybacks (and all-time high) occurred just as the stock market was reaching its all time high. Interestingly, stock buybacks were at their lowest levels in 2002 and 2009, precisely the same time stocks were bottoming.
Since the market’s lows in March 2009, buybacks and the stock market have largely been rising together once again. Analysts and investors frequently celebrate new announcements for buying back stock, seemingly unaware of companies poor historical record of timing the market. Will Apple, among others, choose their timing right this time around? Or will current purchases at new all-time highs destroy value and mark another peak in stocks? History is not on their side.
No comments:
Post a Comment