For the first time since the recovery began, Warren Buffett’s favorite valuation metric has breached the 100% level. That, of course, is the Wilshire 5,000 total market cap index relative to GNP. See the chart below for historical reference.
I only point this out because it’s a rather unusual occurrence and the recent move has been fairly sizable. It happened during the stock market bubble of the late 90′s, but then occurred again just briefly during the 2006-2007 period when the valuation broke the 100% range in Q3 2006 and stayed above that range for about a year. We all know what followed the 2007 peak in stock prices.
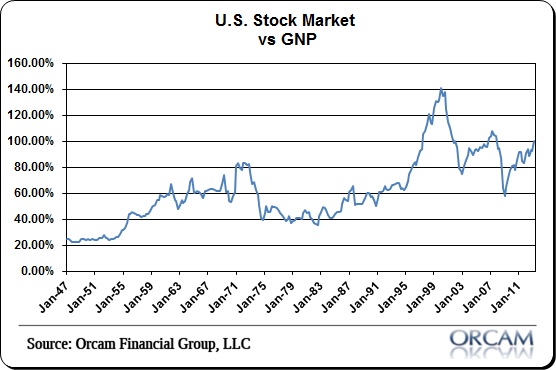
Woj’s Thoughts - These days it’s becoming increasingly tough to find stock market indicators that are not either approaching all-time highs or levels that have only been reached just prior to the onset of a bear market. As shown by the previous two market peaks, clearly this measure can go higher still. Nevertheless, this metric supports the view that the current bull market is much closer to the end than the beginning.
2) A Future of Low Returns? by Timothy Taylor @ Conversable Economist
Here's a figure showing U.S. experience in the long run. The bars on the far right show how annual returns on equity have outstripped those for bonds and for bills from 1900-2012. The middle bars show a similar pattern, a bit less extreme, for the last half-century from 1963-2012. The bars on the far right show the 21st century experience from 2000-2012. Stocks have offered almost no return at all; neither have bills. Bonds have done fairly well, given the steady fall in interest rates, but as interest rates have headed toward zero, the gains from bonds seem sure to diminish, too.
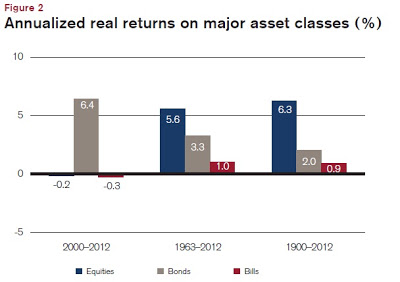
Dimson, Marsh, and Staunton have some grim news for those waiting for a bounceback to 20th century levels of returns: "[M]any investors seem to be in denial, hoping markets will soon revert to “normal.” Target returns are too high, and many asset managers still state that their long-run performance objective is to beat inflation by 6%, 7%, or even 8%. Such aims are unrealistic in today’s low-return world. ... The high equity returns of the second half of the 20th century were not normal; nor were the high bond returns of the last 30 years; and nor was the high real interest rate since 1980. While these periods may have conditioned our expectations, they were exceptional."Woj’s Thoughts - Most people are probably aware that equity returns have been dismal, so far, during the 21st century. What I find striking is how small the gap between equities and bonds has been over the past fifty years. Sure 2.3% in real terms is significant, especially over a long-time horizon, but given the severely different levels of risk shouldn’t this figure be higher? For those interested in many other great charts and more in-depth discussion, check out the Credit Suisse Global Investment Returns Yearbook 2013.
No comments:
Post a Comment