First, Joe offers a version of the “underconsumption” hypothesis, basically that the rich spend too little of their income. This hypothesis has a long history — but it also has well-known theoretical and empirical problems.
It’s true that at any given point in time the rich have much higher savings rates than the poor. Since Milton Friedman, however, we’ve know that this fact is to an important degree a sort of statistical illusion. Consumer spending tends to reflect expected income over an extended period. If you take a sample of people with high incomes, you will disproportionally include people who are having an especially good year, and will therefore be saving a lot; correspondingly, a sample of people with low incomes will include many having a particularly bad year, and hence living off savings. So the cross-sectional evidence on saving doesn’t tell you that a sustained higher concentration of incomes at the top will lead to higher savings; it really tells you nothing at all about what will happen.
So you turn to the data. We all know that personal saving dropped as inequality rose; but maybe the rich were in effect having corporations save on their behalf. So look at overall private saving as a share of GDP:
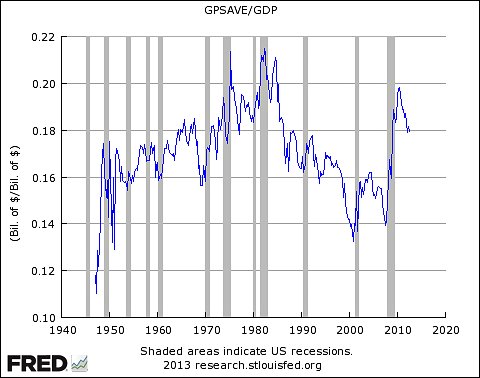
The trend before the crisis was down, not up — and that surge with the crisis clearly wasn’t driven by a surge in inequality.
Not convinced by Krugman’s analysis, Arthur Shipman considers other potential reasons that gross saving might have fallen in response to rising inequality. As he wisely points out, the above trend is reminiscent of the change in inflation rates: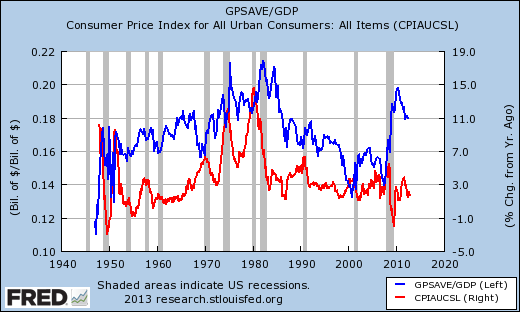
and even more so, the pattern of interest rates: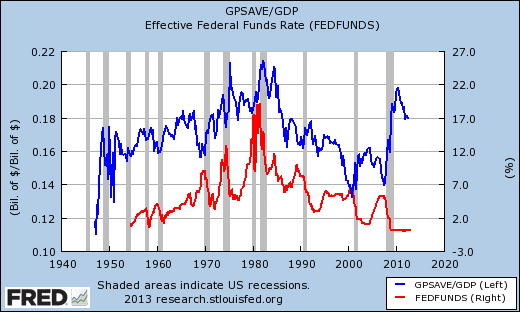
Still unsatisfied, Arthur concludes:
While I won’t disagree with Arthur’s conclusion, I think a potentially satisfying explanation does exist if one disaggregates gross private saving.
and even more so, the pattern of interest rates:
Still unsatisfied, Arthur concludes:
So are there a lot of explanations for why Krugman's graph goes up and down?
There must be.
While I won’t disagree with Arthur’s conclusion, I think a potentially satisfying explanation does exist if one disaggregates gross private saving.
Gross private saving = personal saving + wage accruals less disbursements + consumption of fixed capital (domestic business + households and institutions) + undistributed corporate profits with inventory valuation and capital consumption adjustments.
Using interactive data from the Bureau of Economic Analysis, Krugman’s chart can be recreated to depict each of the disaggregated measures as a percentage of GDP:
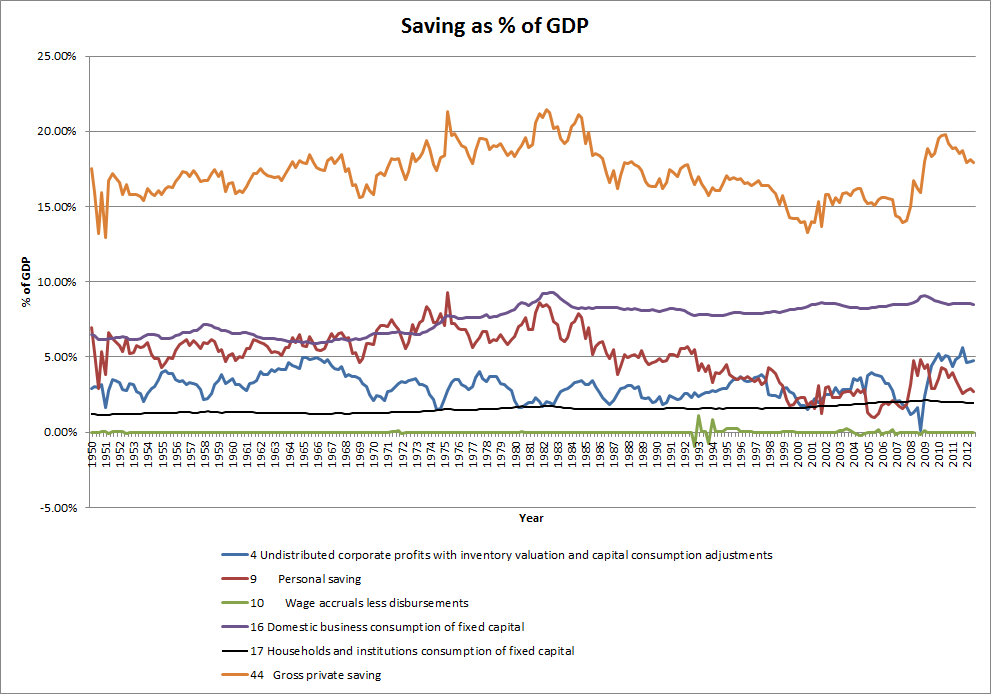 This chart makes it patently obvious that the sharp swings in gross private saving, as a percentage of GDP, are almost entirely due to changes in personal saving and undistributed corporate profits with inventory valuation and capital consumption adjustments.
Specifically focusing attention on the period from the mid-1980’s up to the recent crisis, the entire decline in gross private saving is basically due to declining personal saving. Can this observation be reconciled with rising inequality during the same time period?
In my view, the staggering fall in personal saving can not only be reconciled with rising inequality but also with declining inflation and interest rates. Rising income and wealth inequality starting in the 1980’s meant that many households could no longer maintain relative levels of consumption based solely on disposable income. Assuming this trend would not persist indefinitely, or maybe just unwilling to lower relative consumption, a proportion of households either drew upon previous savings or sought out loans (new debt) to temporarily raise consumption. As the upward trend in inequality persisted, more households elected to reduce savings or, having exhausted their savings, increase demand for debt.
Coincidently, inflation and interest rates were steadily declining during these years. Combined with numerous new debt subsidies and implicitly increasing federal backing, banks were all too eager to meet the rising demand for credit. This explosive expansion of credit is readily apparent in the following chart of household debt to GDP:
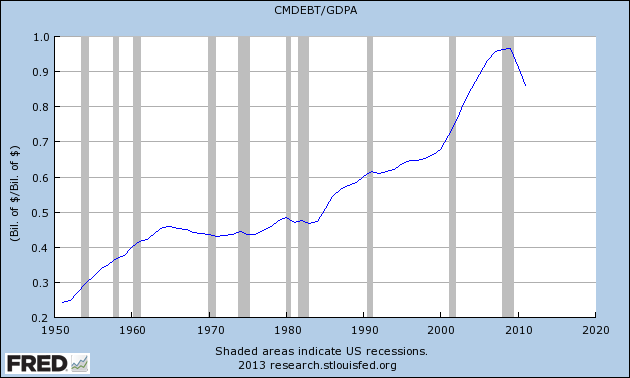
The concurrent drawing down of savings and growing stock of outstanding debt among households provides a very straightforward explanation for how inequality drove the observed decline in personal saving.
Returning to the disaggregated chart of saving as a percentage of GDP, the reasons behind the sharp rise during and after the recent crisis are also much clearer. On the household side, declining home values and rising unemployment clearly brought about a shift in personal saving. Having already amassed a large stock of debt, households were pressured to increase saving in order to meet the principal and interest payments coming due. Furthermore, recognition by many households that previous saving was insufficient for present retirement plans may have added to the rise in personal saving.
Switching to the corporate side, the change in undistributed corporate profits can also be disaggregated into its distinct parts:
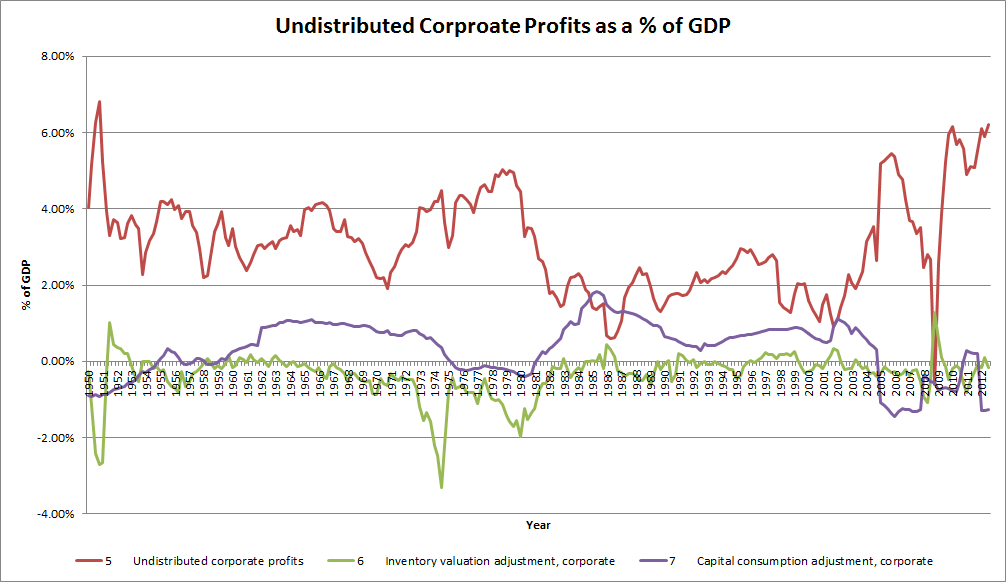 The recent crisis saw an unparalleled fall and rise in undistributed corporate profits that returned the percentage to heights previously witnessed only briefly sixty years ago. It’s also worth noting that undistributed corporate profits had risen significantly following the bursting of the dot-com bubble. Contrary to Krugman’s claim, this suggests wealthy households were and are continuing to use corporations as a means of effective saving.
 By disaggregating the data for gross private savings, the drivers behind the large fluctuations and trends become increasingly apparent. This data is consistent with rising income and wealth inequality but requires reversing Stiglitz’s “underconsumption” hypothesis. Trying to maintain relative consumption levels, many households clearly chose to rely on previous savings or new debt as a means of temporarily boosting consumption. As inequality continues to rise, wealthy households are now electing to retain more of their savings within corporations. It doesn’t take a leap of faith to suggest this combination of factors depresses aggregate demand. Stiglitz is therefore correct in concluding:
Now we realize that we are paying a high price for our inequality and that alleviating it and promoting growth are intertwined, complementary goals. It will be up to all of us — our leaders included — to muster the courage and foresight to finally treat this beleaguering malady.
Woj,
ReplyDeleteThis is really fantastic analysis, thanks for sharing!
Thanks for the support!
DeleteKrugman: "It’s true that at any given point in time the rich have much higher savings rates than the poor. Since Milton Friedman, however, we’ve know that this fact is to an important degree a sort of statistical illusion. Consumer spending tends to reflect expected income over an extended period. If you take a sample of people with high incomes, you will disproportionally include people who are having an especially good year, and will therefore be saving a lot; correspondingly, a sample of people with low incomes will include many having a particularly bad year, and hence living off savings."
ReplyDeleteWell, that convinces me that income is definitely not a good operational definition of how rich someone is. ;)
Very true. Personally I think too many people focus on income inequality and ignore the multitude of ways that wealth is built and maintained separate from income. That's why I true to mention wealth inequality in these discussions, which also helps to understand the actions of CBs on asset markets and changes to tax policies.
DeleteThis is very good trading advice. I’ve been studying your site and this other site.
ReplyDeletehttp://tinyurl.com/investing0028