A common story holds that the key cause of the financial turmoil in the U.S over the last two decades was the excessively low interest rates. This perspective lays the blame for the financial crisis at the feet of discretionary Federal Reserve policy, and is typically made based on the fact that short term rates such as the federal funds rate or Treasury bill rates had been lower between 2001 and 2011 than in any previous decade. In short, this view claims that rates were “too low for too long.”Trying to verify this story:
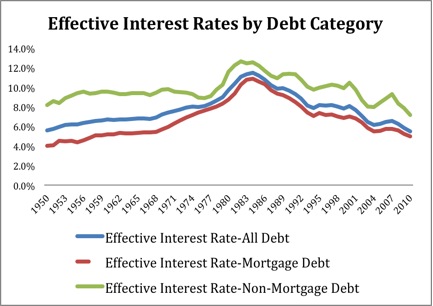
In ongoing work, Josh Mason and I look at actual interest payments to calculate the effective inflation adjusted interest rate on debt for households and for non-financial corporations. We find that the inflation-adjusted effective interest rates for households and non-financial corporations are nowhere near their historic lows during the early 2000s. While the rates are lower than anytime since the 1980s, interest rates were as low during the long period from 1950 to 1970 and certainly in the high inflation period of the 1970s.Which is accompanied by the following graph:
These findings are actually reflected in data on the real changes in household debt per year:
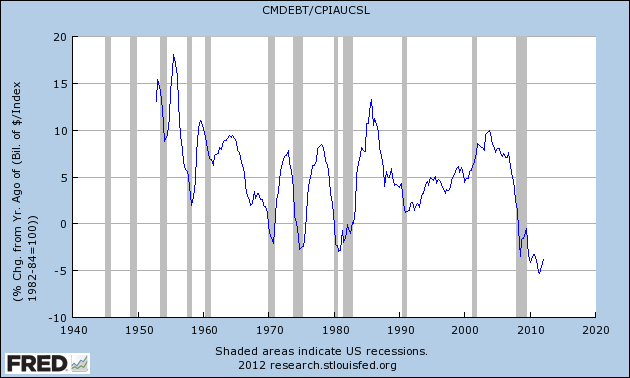 From this graph we see that household debt grew at the fastest pace in the early 1950’s, when effective interest rates were lowest, then slowed through the 1970’s reaching a local low in the early 1980’s, when effective rates were highest. As rates steadily declined from there, debt growth remained positive until the start of the crisis in 2009.
 While these findings appear to invalidate the “common story” told above, it leaves questions regarding my own story of the Great Recession. In my story, households (and the private sector generally) accumulated increasing levels of debt compared to income. Interest costs on this debt transferred purchasing power away from the productive sectors (household and private non-financial) to the non-productive sector (financial), which ultimately resulted in a decline of aggregate demand. The above charts show previous periods of comparable increasing debt, so why was this time different?
Since debt was apparently not growing at excessive rates, let’s consider the other half of the equation...income:

Although it’s a bit tough to discern from the above chart, average real disposable personal income has been declining every decade since the series began in 1960. (The 1960’s saw average growth of 4.5%, while the 2000’s witnessed only 2.4% growth). The consistent decline in earnings growth provides a good explanation of why, despite similar rates of debt expansion, household debt-to-GDP looks like this:
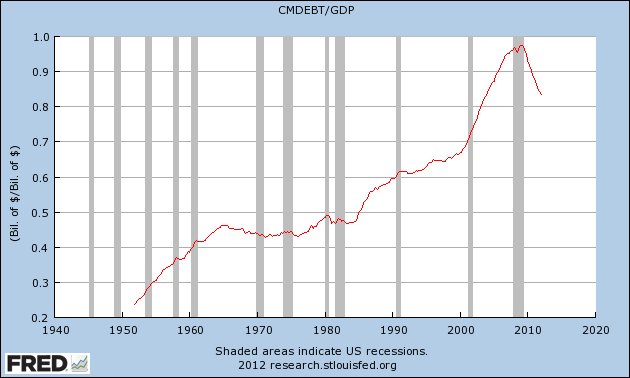
The first substantial rise (~1950-1965) in this ratio appears to have been driven by increased borrowing due to low effective interest rates, while the second massive upswing (~1983-2009) was seemingly driven by decreasing effective interest rates combined with weak income growth.
The above chart also helps explain why this time was different with regards to interest costs. Jayadev and Mason’s findings above only highlights the effective interest rate on each dollar of household debt. To understand the true burden of interest costs at the onset of the crisis, we must consider the total interest cost on accumulated debt. Since total household debt is still a much greater percentage of income, and effective interest rates are not significantly lower, the real burden of that debt is much higher.
Based on this data, it seems reasonable to conclude that low interest rates were not the primary culprit in the financial crisis. A more important area of research may be understanding why debt growth was not slowed by the decline in incomes. This preliminary review suggests that low incomes, not low interest rates, played a greater role in the crisis.