Showing posts with label Private Debt. Show all posts

Friday, March 15, 2013

Hudson, Keen, Smith and Others Explain Why Private Debt is the Problem

This past Wednesday I attended The Atlantic’s Second Annual Economy Summit featuring many previously high ranking government officials (e.g. Federal Reserve Chairman Paul Volcker, Secretary of the Treasury Robert Rubin, and FDIC Chairman Sheila Bair). Though these former public officials and many others remained focus on the issue of public debt and deficits, the conference was actually promoted on the basis of turning the focus to private debt. Since my understanding of economics suggests concerns over private debt should be the main focus of current policy, I was personally excited to hear from Steve Keen, Michael Hudson and Yves Smith.

To provide a quick gist of the discussion during these morning panels and the detrimental effects of excessive private debt, here are a few snippets from Michael Hudson’s prepared remarks:

The result of the private-sector debt overhang is a self-feeding spiral of debt deflation. Revenue earmarked to pay bankers is not available to spend on goods and services. Lower consumer spending is a major reason why firms are not investing in tangible capital to produce more output. Markets shrink, shopping malls close down, and empty stores are appearing for rent on major shopping streets from New York City to London.
Slowing employment is causing a state and local budget squeeze. Something has to give – and it is largely pension plans, infrastructure spending and social programs.
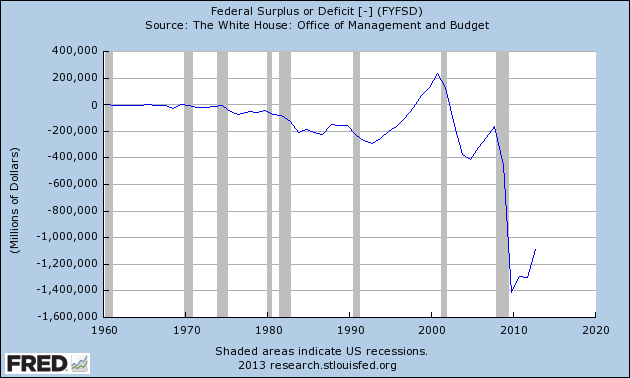
However, the one kind of debt we are not worried about is government debt. That’s because governments have little problem paying it. They do not need to balance their budget with tax revenue, because their central bank can simply print the money. On balance, the overall public debt rarely needs to be paid down. As Adam Smith noted in The Wealth of Nations, no government in history ever has paid off its public debt.
The policy lesson for today is that to avoid debt deflation, falling markets and unemployment, the economy needs to be revived. The way to do this is what was called for and indeed promised four years ago: a write-down of debts in keeping with the ability to pay.
Once this debt overhead is addressed, tax reform is needed to prevent a debt bubble from recurring. A tax system that favors debt financing rather than equity, and that favors asset-price “capital” gains and windfall gains over wages and industrial profits earned by producing tangible output, has been largely to blame. Also needing reform is tax favoritism for the offshore fictitious accounting that has become increasingly unrealistic in recent years.
Unless government fiscal policy addresses these issues, the U.S. economy will face the same kind of debt-deflation pressures and fiscal austerity that is now tearing the eurozone apart.
As the only two economists in attendance who predicted the financial crisis and subsequent stagnation, Hudson and Keen’s panel stood out in offering practical policy responses that will not further increase wealth inequality or the financial sector’s profits/influence:
Good Debt, Bad Debt & Real Options for Economic Growth from The Atlantic on FORA.tv

A brief detour from discussion of the conference, Professor Steve Keen has been working hard on building a computer program for building & visually simulating dynamic, monetary economics models: http://kck.st/XhKtdX
There are only 2 days left to show your support for the project on Kickstarter and help reach the secondary funding goal of $100,000. Please check out the Kickstarter page for more information and consider making a pledge to improve the future of economics:
MINSKY: Reforming economics with visual monetary modeling

Returning to the conference and giving credit where its due, The Atlantic has been working with and, in the afternoon session, featured Richard Vague’s work on “How to Deal With America’s Private Sector Debt Challenge”:

How to Deal with America's Private Sector Debt Challenge from The Atlantic on FORA.tv

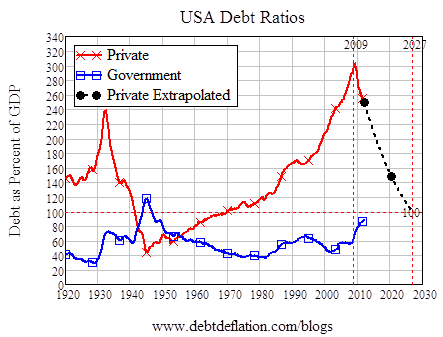
Slides from the presentation and a host of other fantastic data can be found at the Debt Economics website.

Lastly I’ll recommend watching the first panel of the day which included not only Yves Smith but deficit doves Paul McCulley and Robert Kuttner:

Robert Kuttner & Others Debate U.S.'s Addiction to Debt from The Atlantic on FORA.tv

(Unfortunately the moderator was particularly determined to focus the conversation on the Ryan budget and public debt issues).

While I don’t know how many conference attendees will have been swayed by the presentations above, I think it’s a step in the right direction that these discussions are at least taking place within the mainstream community.


(Note: Although I was already a big supporter of Keen, Hudson, and Smith’s work, I should note that all three were incredibly gracious in conversation when I approached them. Separately, I apologize for the lack of blogging during the past couple weeks. My last midterm is Monday night and I hope to return to more frequent shortly thereafter.)

Saturday, March 2, 2013

Targeting Nominal Wealth Leads to a Bubble Economy, Not Stabilizing the Business Cycle

Over the past few years it has become increasingly clear that the Federal Reserve and federal government are targeting rising asset prices, rather than incomes, as a way of generating economic growth. A recent post outlined some of the dangers of persistent negative real interest rates:
Households and businesses “with access to cheap borrowing” have been pouring money into stock, bond, housing and commodity markets rather than investing in tangible capital. The remarkable rise in asset prices has unfortunately not funneled down to households in the bottom four quintiles of income and wealth, only furthering the inequality gap.
Cullen Roche addressed a similar issue yesterday in a post on The Fed’s Disequilibrium Effect via Nominal Wealth Targets:
Fed policy and the monetarist perspective on much of this can be highly destabilizing by creating this sort of ponzi effect where asset prices don’t always reflect the fundamentals of the underlying corporations.  It’s not a coincidence that we’ve have 30 years of this sort of policy and also experienced the two largest nominal wealth bubbles in American history during this period.
The title of this blog is also not a coincidence, since my formative years encompassed both the dot-com and housing bubbles. My relatively limited experience with financial markets and macroeconomics (based on age) has been punctuated by financial instability. These memories are the driving factor behind my desire to study financial instability and inform policy decisions that can stabilize the business cycle.

In a recent post on The Spinning Top Economy, Matthew Berg helps further my goal with insight on measuring financial instability (my emphasis):

Now we have Government IOUs on the bottom, serving as the base of the economy. Bank and Non-Bank IOUs are leveraged on top of those IOUs – somewhat precariously.
In fact, you can think of the economy as a spinning top rather than a pyramid. Like a spinning top, the more top-heavy the economy becomes, the greater its tendency to instability, and the more readily it will topple over and collapse in a financial crisis.


Now, what happens if, as was the case during the dot-com bubble and the housing bubble, private sector net financial assets go negative but net worth continues to grow?
In fact, the difference between the measures of net financial assets and net worth provides us with a good rule of thumb for how to spot a bubble economy. If private sector net worth is growing at a greater rate than private sector net financial assets are growing, then that means that the economy – symbolized by our spinning top – is growing more top-heavy.
So, what happens if we make the spinning top more top-heavy? You can go ask your nearest Kindergartener – it becomes more likely to topple over.
Since Matthew provides the guidelines for spotting “a bubble economy,” let’s take a look at the empirical data to see how well it aligns with the story. The first chart displays the growth rates of private sector net financial assets (NFAs) and private net worth over the past 20 years*:
The negative growth rate in private NFAs corresponds with the Clinton surpluses, while the two positive surges are due to the Bush tax cuts and Bush/Obama stimulus measures. Turning to the growth in private net worth, the brief decline stems from the bursting dot-com bubble and the massive drop from cratering house prices. Combining the two measures will show when/if the economy was becoming “top-heavy” (first chart displays the past 50 years; second chart is the same data but only the past 20 years, for clarity):

Past 50 Years
Past 20 Years
Growth of private net worth began outpacing the growth of private NFAs in 1995 for the first time since 1979. The difference in growth rates then remained positive for 10 of the next 11 years. This streak is truly remarkable given that prior to 1995, the difference had only been positive in five other years dating back to 1961.** At the end of 2006, the U.S. economy was clearly more “top-heavy” than any previous time in the post-war era.

Over the past three decades, growth in private debt exceeding income and declining nominal interest rates have generated enormous returns for asset holders. Throughout the 1980’s and early 1990’s, federal deficits provided more than enough NFAs to keep pace with rising private net worth. Then, in 1995, deficits began decreasing just as the growth of net worth (and private debt-to-GDP) began accelerating higher. The unsurprising result has been more than a decade of meager asset returns, subpar economic growth and high unemployment.

The government policy of targeting nominal wealth, driven by an expansion of private debt, has failed not only at increasing net worth but also, and more importantly, at creating sustainable growth in output and employment. Going forward the focus of policy must return to promoting the growth of income and assets, which in turn will fuel higher output, employment and ultimately wealth.   


*Data for private net worth comes from the Federal Reserve’s Flow of Funds Accounts of the United States (Z.1). Data for private net financial assets (NFAs) comes from the National Income and Product Accounts (NIPA) at the BEA.

**Aside from 1979, growth of private net worth exceeded the growth of private NFAs in 1961, 1965, 1969 and 1978 (0.05%).

Related posts:
The Rise of Debt, Interest, and Inequality
Fear of Bubbles, Not Inflation, Returns to the Fed
Why the Federal Reserve Mandate Means That Bernanke Doesn't Have to Worry About Bubbles

Monday, February 11, 2013

The Rise of Debt, Interest, and Inequality

According to Paul Krugman, he’s “had a mild-mannered dispute with Joe Stiglitz over whether individual income inequality is retarding recovery right now.” Since both Nobel Laureates were focusing on gross private savings, I broke down that measure by individual components and sub-components. Insights gained from those charts led to the conclusion that:
This data is consistent with rising income and wealth inequality but requires reversing Stiglitz’s “underconsumption” hypothesis. Trying to maintain relative consumption levels, many households clearly chose to rely on previous savings or new debt as a means of temporarily boosting consumption. As inequality continues to rise, wealthy households are now electing to retain more of their savings within corporations. It doesn’t take a leap of faith to suggest this combination of factors depresses aggregate demand.
Still unconvinced, Krugman has been searching for further data (see here and here) that would lead him to believe inequality really is holding back the recovery.

Hoping to aid Krugman in his quest and expand upon my “overconsumption” theory, let me respond to a critique of the previous post. Over at Mike Norman Economics, a commenter (Ryan Harris) kindly noted the obvious omission of interest income and sectoral balances. After sorting through interactive data from the Bureau of Economic Analysis, here are net amounts of monetary and imputed interest by sector [positive (negative) total implies sector receives (pays) net interest]:


Unsurprising to those familiar with sectoral balance analysis, households net interest position took a sharp turn upwards when federal budget deficits began expanding more rapidly in 1980:

Around the same time, household interest income received a significant boost from the nonfinancial business sector. The pronounced decline in the net interest position of that sector aligns closely with high interest rates of the preceding period and a massive expansion of nonfinancial corporate debt shortly afterwards:

Since then the rise and fall of nonfinancial interest payments (and outstanding debt) has tracked the business cycle, with the overall trend remaining steadily lower (higher net payments and outstanding debt). Although these transfers support household income, they also increase income inequality since wealthy households hold a vast majority of financial assets (including corporate debt).

Turning to the foreign (rest of the world) sector, the U.S. current account (trade) balance fell heavily in the 1990’s:

Foreign countries began amassing large quantities of U.S. financial assets (primarily Treasuries) corresponding to the substantial trade deficits. The growth in net interest receipts arising from these holdings represents an ongoing leak in domestic aggregate demand.
   
With the beginning of a new millennium and the dot-com bubble, a hostile environment was created for the household net interest position. Federal budget surpluses, declining interest rates, rapidly expanding trade deficits, and increasing payments to the financial sector (for housing) led to a nearly 40% decline in household net interest receipts. Combined with increasing income inequality, many households drew upon savings and increased demand for new debt to maintain previous levels of consumption.

A side effect of the budget surpluses was a growing desire for safe financial assets separate from U.S. Treasuries. Securitization provided a means for new loans of varying risk to be converted into supposedly “super-safe” assets and transferred off of bank’s balance sheets. These factors encouraged banks to meet the surging demand for new loans coming from households (Chart: Household Debt-to-GDP):

The effects of these transactions can also be seen in the transfer of net interest payments from households, and later businesses, to the financial sector. Apart from adding to inequality, these transfers reduce aggregate demand since, as Michael Hudson notes in The Bubble and Beyond, “financial institutions tend to save all their income.” (2012: Kindle Locations 6814-6815)

Since the financial crisis ended, the trend towards higher net interest receipts by the financial sector and greater net interest payments by the nonfinancial corporate sector have returned. These transfers of income up the income/wealth ladder serve to exacerbate the weak demand stemming from two decades of stagnating household interest income. Unfortunately, and so far unsuccessfully, public policy (fiscal and monetary) remains dedicated to originating a new private debt led boom.  

The changes in net interest payments/receipts over the past few decades highlight the growing income and wealth disparities present in our society. For many years households dug themselves deeper in debt to maintain relative consumption levels. The costs of excessively accumulating private debt have now been recognized, but the burden of interest payments suppressing aggregate demand will be felt for years to come.  

  
Bibliography
Hudson, Michael (2012-10-04). THE BUBBLE AND BEYOND (Kindle Locations 6814-6815). ISLET. Kindle Edition.

Friday, January 25, 2013

Bubbling Up...1/25/13

1) S&P 500 Earnings Squiggles by Ed Yardeni @ Dr. Ed’s Blog
The estimates for 2012 and 2013 mostly fell all last year, yet the S&P 500 rose 13.4%. I have the Squiggles data back to 1979 on a monthly basis. More often than not, they tend to trend down; yet more often than not, the market has trended higher. That’s because the market discounts 12-month forward consensus expected earnings. A good proxy for this concept is forward earnings, i.e., the time-weighted average of consensus estimates for the current and coming years. It tends to be a good 12-month leading indicator for actual profits, with one important exception: Analysts don’t see recessions coming until we all do too.
Woj’s Thoughts - After viewing this chart a few times, several observations stand out from the rest: 1) Each “earnings squiggle” that rises near the end is associated with higher actual earnings. 2) Each “earnings squiggle” that falls near the end forecasts at least a temporary decline in actual earnings. 3) Earnings estimates for 2010, at the beginning of 2009, were higher than forecasts for the current year (2013) and equivalent to current estimates for 2014. 4) The clear upward bias in estimates promotes higher prices, to the degree market participants trust the forecasts. 


2) Why the US economic crisis is a depression and not a recession by Edward Harrison @ Credit Writedowns

What is now playing out in Congress is very much in line with what I said a little over three years ago in October 2009. Deficit fatigue has become too large to resist. Austerity is coming to the US. The crux here is to remember that this has been a crisis brought on by high private debt – not public debt or deficits. The government has been effective in preventing a private sector debt deflation by providing economic stimulus, permitting large-scale deficit spending and bailing out the banks. This has added a huge slug of net financial assets to the private sector and supported asset prices and private sector balance sheets. When these government deficits get cut, there will be serious pain in the private sector because balance sheets are still stressed and the result will be a relapse into economic depression.
Woj’s Thoughts - The House Republicans have agreed to temporarily raise the debt ceiling and postpone the debate over sequestration in return for Congress (focusing on the Senate Democrats) actually passing a budget for the first time in four years. Backed into a corner, this is probably the best decision for the Republicans as it puts the onus (temporarily) on Democrats to reach a budget agreement. This progression raises the chances that spending cuts, either tied to sequestration or the budget, will take place this year. With the tax hikes already in place, the smaller deficits could very well lead to the outcome that Edward fears.  

3) Ben Bernanke Is Facing A Legacy Problem by Bruce Krasting @ Money Game
Bernanke’s term at the Fed will set many historical precedents. To a significant extent, history will judge Bernanke on what he did while chairman of the Fed. But the books will also look at what happened after he left.
I believe that Bernanke would very much like to leave his successor with a Fed that had policy choices. As of today there are no options left.  Just more useless QE. I doubt that Bernanke wants to exit with the Fed’s foot planted firmly on the gas pedal. The next guy does deserve a cleaner plate than now exists.
Is the Legacy factor influencing Bernanke? I think it has some sway in his thinking. Consider what Greenspan did before he left. After years of soft monetary policy he ratcheted up the Federal Funds rate 17 times in 22 months. He took the funds rate from 1% all the way up to 6%. Part of that rapid increase was driven to get monetary policy “neutral”, so that Bernanke could do as he wished. Not long after Bernanke took over, he took the funds rate down to zero.
Clearly, Greenspan tried to get monetary policy back to neutral before he left, I don’t see any reason why Bernanke would think differently. Are we watching a repeat of history? At a minimum, his legacy, and where he wants the Fed to be when he leaves,  is part of Ben’s thinking today.

Woj’s Thoughts - It’s hard to argue with this logic given Greenspan’s actions as Fed Chairman prior to the last two years of his reign. While deserve is an overly strong word in this instance, my guess is the next Fed Chairman would appreciate having the option to ease, beyond merely expanding QE. With initial unemployment claims now at multi-year lows and a labor force still in decline, the table is set for a further meaningful drop in the unemployment rate. As the rate approaches 7 percent, I suspect Fed chatter about ending QE will pick up. If the legacy issue is simultaneously weighing on Bernanke’s mind, the urge to pull back on easing may be too great to ignore. Considering the ongoing multiple expansion in stock markets, it appears most market participants are not yet discounting this potential outcome.

Tuesday, January 22, 2013

Quote of the Week...


...is from Michael Hudson’s fantastic book, The Bubble and Beyond:
Central bank policies that raise interest rates to slow new direct investment and hiring make economies even less able to carry their debt burden. In this respect the buildup of savings and encouragement of debt financing encourages a buildup of financial returns rather than tangible capital investment. Thus is antithetical to the goal of promoting high wages and rising labor productivity. The rate of interest is permitted to govern the doubling times of savings without the moral, political and religious checks that have rolled back the growth of financial overhead throughout history. There is only one ultimate solution: Debts that cannot be paid, won't be. The open question is, will this tear economies apart as the financial sector fights against fate?
There are clear signs from around the globe that this process is, in fact, tearing economies apart. Despite mass unemployment and declining living standards, many countries continue to support their private financial institutions in the misguided hope that further lending will make households and nonfinancial corporations better able to carry their debt burdens. Until this process is dismantled or reversed, the prospects for sustained economic growth in these countries remains heavily subdued.

Sunday, December 30, 2012

Private Debt and Modern Cost-Push Inflation

The Arthurian rekindles consideration of Cost-Push Inflation: An Issue Resolved, or Simply Dismissed?:
At The Everyday Economist some months back, Josh Hendrickson captured my attention with his Nominal Income and the Great Moderation. In that post, Hendrickson introduced a forthcoming paper and said:
As I argue in the paper, during the Great Inflation period of the 1970s, members of the FOMC regularly asserted that the process of inflation determination had changed. Relying on public statements and personal diary entries from Arthur Burns, I demonstrate that there is little evidence that the Federal Reserve was less concerned with inflation during the 1970s. Rather, the view of Burns and others was that inflation was largely a cost-push phenomenon. Burns thought that incomes policies were necessary to restore price stability and stated that “monetary and fiscal tools are inadequate for dealing with sources of price inflation that are plaguing us now.”
The shift in policy, beginning with Paul Volcker, was an explicit attempt to stabilize inflation expectations and this was done deliberately at first through monetary targeting and ultimately through the stabilization of nominal income growth. Gone were notions of cost-push versus demand-pull inflation.
I can see a natural progression there: from the thought that "incomes policies were necessary" to policies for "the stabilization of nominal income growth." Incomes policies means wage-and-price controls. The method is crude, but the objective of wage and price controls is precisely "the stabilization of nominal income growth."
Beside the point. What concerns me is "the view of Burns and others was that inflation was largely a cost-push phenomenon." That, and the apparent fact that this issue of cost-push was never resolved. It was simply dismissed.
As with many aspects of science, there is an inherent desire to find one all-encompassing explanation for macroeconomic phenomenon. Maybe it’s naivete, or pragmatism, but there seems little reason to expect one simple reason behind inherently complex phenomena. Returning to inflation, maybe a simple primary cause exists at certain periods of time and in certain locations, but throughout history there may very well be numerous causes.

Approaching the question of inflation from a Keynesian perspective, it seems obvious that demand-led inflation is plausible. Individual’s desire for goods can clearly shift faster than the economy’s ability to produce new output. Similarly, from a Monetarist perspective, one can easily envision an excess supply of money causing a decline in its value that represents an increase in the price level. Or, as Nick Rowe suggests, maybe monopoly power causes inflation.

While all of the above views likely have their time and place, a way to reconcile cost-push inflation with today’s circumstances may not exist within mainstream models. In The Bubble and Beyond, by non-mainstream economist Michael Hudson, a case is made whereby rising interest expenses on debt could generate cost-push inflation. Over the past 30 years, there has been a massive increase in the amount of private debt both at the household and corporate levels. The reliance on debt funding involves interest expenses that push up the cost of production. Since interest expenses can rise at compounding rates, the impact on the overall cost structure becomes larger over time. These effects on inflation may help to explain persistent inflation throughout the recent crisis despite the significant drop in aggregate demand and broad measures of money.

The cost-push inflation of an earlier era may be gone, but the phenomena may still be with us today. The dismissal of private debt and interest expenses from macro models may be the reason the issue of cost-push inflation was “simply dismissed.”   

Thursday, November 8, 2012

Koo–Krugman Paradox? - Jonathan Finegold

I’d like to share one thing in particular from Koo’s book, (The Holy Grail of Macroeconomics)
[A]fter the bubble collapsed in Japan, not only were there no willing borrowers, but existing borrowers were paying down debt — and they were doing so when interest rates were at zero. Technically insolvent companies, struggling to pay down debt and repair balance sheets hit by the nationwide plunge in asset prices, were not interested in borrowing money, regardless how far the central bank lowered rates. In this environment, monetary policy by itself no longer has any effect.
— p. 29.
...
Some time ago Krugman suggested that Koo isn’t entirely right,
Koo’s argument is that interest rates and monetary policy don’t matter because everyone is debt-constrained. That can’t be right; if there are debtors, there must also be creditors, and the creditors must be influenced at the margin by interest rates, expected inflation, and all that.
Read the rest at Economic Thought
Koo–Krugman Paradox?
By Jonathan Finegold

I haven't read Koo's book yet, but have been equally fascinated by his ideas through various other works. Regarding the difference between Koo and Krugman on the creditor-borrower dichotomy, I think it boils down to whether one accepts the loanable funds paradigm or not. Krugman, seemingly accepting the premise, believes that creditors (banks) are limited in credit creation by funds from savers and to some degree central bank reserves. In that case it would be true that a relatively large portion of the population would not become debt-constrained at a given time.

Now consider the opposing view, that banks create deposits and are only constrained by capital requirements (to a degree) and the willingness of borrowers to accept the bank's liabilities (which is supported by an implicit/explicit federal guarantee). Banks can therefore lend well in excess of current income and savings. In this scenario, a very significant portion of the population could become debt-constrained. If this is true, debt-constraints can become far more powerful (as Koo suggests) and may render monetary policy ineffective even with higher inflation expectations.

Personally I find the second example far more convincing given my readings and experience. I should also note that In Koo’s scenario, while demand for credit is weak, banks may also tighten credit restrictions since there is some level of debt-to-income (or assets) where the expected return of lending to a potential borrower becomes negative.

Tuesday, August 21, 2012

Low Incomes, Not Low Interest Rates, Were Behind The Crisis

Arjun Jayadev notes that:
A common story holds that the key cause of the financial turmoil in the U.S over the last two decades was the excessively low interest rates. This perspective lays the blame for the financial crisis at the feet of discretionary Federal Reserve policy, and is typically made based on the fact that short term rates such as the federal funds rate or Treasury bill rates had been lower between 2001 and 2011 than in any previous decade. In short, this view claims that rates were “too low for too long.”
Trying to verify this story:
In ongoing work, Josh Mason and I look at actual interest payments to calculate the effective inflation adjusted interest rate on debt for households and for non-financial corporations. We find that the inflation-adjusted effective interest rates for households and non-financial corporations are nowhere near their historic lows during the early 2000s. While the rates are lower than anytime since the 1980s, interest rates were as low during the long period from 1950 to 1970 and certainly in the high inflation period of the 1970s.
Which is accompanied by the following graph:

These findings are actually reflected in data on the real changes in household debt per year:
From this graph we see that household debt grew at the fastest pace in the early 1950’s, when effective interest rates were lowest, then slowed through the 1970’s reaching a local low in the early 1980’s, when effective rates were highest. As rates steadily declined from there, debt growth remained positive until the start of the crisis in 2009.

While these findings appear to invalidate the “common story” told above, it leaves questions regarding my own story of the Great Recession. In my story, households (and the private sector generally) accumulated increasing levels of debt compared to income. Interest costs on this debt transferred purchasing power away from the productive sectors (household and private non-financial) to the non-productive sector (financial), which ultimately resulted in a decline of aggregate demand. The above charts show previous periods of comparable increasing debt, so why was this time different?

Since debt was apparently not growing at excessive rates, let’s consider the other half of the equation...income:
Although it’s a bit tough to discern from the above chart, average real disposable personal income has been declining every decade since the series began in 1960. (The 1960’s saw average growth of 4.5%, while the 2000’s witnessed only 2.4% growth). The consistent decline in earnings growth provides a good explanation of why, despite similar rates of debt expansion, household debt-to-GDP looks like this:
The first substantial rise (~1950-1965) in this ratio appears to have been driven by increased borrowing due to low effective interest rates, while the second massive upswing (~1983-2009) was seemingly driven by decreasing effective interest rates combined with weak income growth.

The above chart also helps explain why this time was different with regards to interest costs. Jayadev and Mason’s findings above only highlights the effective interest rate on each dollar of household debt. To understand the true burden of interest costs at the onset of the crisis, we must consider the total interest cost on accumulated debt. Since total household debt is still a much greater percentage of income, and effective interest rates are not significantly lower, the real burden of that debt is much higher.  

Based on this data, it seems reasonable to conclude that low interest rates were not the primary culprit in the financial crisis. A more important area of research may be understanding why debt growth was not slowed by the decline in incomes. This preliminary review suggests that low incomes, not low interest rates, played a greater role in the crisis.

Tuesday, August 7, 2012

Bubbling Up...8/7/12

1) The week when Mr Draghi greatly diminished the office of ECB President and sacrificed the fiscal-monetary policy distinction (in a manner that does not even help the euro in the short run!) by Yanis Varoufakis
What was the ECB’s position before Draghi’s heroic declarations? It was that it cannot arrest the crisis unless member-states act as part of a Grand Deal on how to effect a Eurozone-wide fiscal policy. Then and only then, the ECB would bolster their efforts through its own monetary operations. Clearly, that position led markets to believe that the Eurozone had no credible plan for dealing with the Crisis, as the cart (fiscal union) was being placed before the horses (serious ECB-centred intervention to stop the death embrace between insolvent banks and insolvent nations).
And what is the Draghi position after Thursday’s crucial ECB board meeting? That the ECB is ready to buy bonds in the secondary market once member-states act as part of a Grand Deal on how to effect a Eurozone-wide fiscal policy. In other words, no change whatsoever. None!
Woj’s Thoughts - Yanis and I are clearly on the same page. See ECB's Changing Philosophy is Good for Bond Holders but Bad for the Economy and ECB's Means (Lost Decade With High Unemployment) To An End (Structural Reform)

2) Draghi’s comments about the ECB doing “whatever it takes” are irrelevant by Edward Harrison
There is only one issue here: how many reforms the periphery will undertake. There will be no support unless we see reforms. If the periphery capitulates and slashes government jobs, raises pension ages, and makes it easy to fire people, Germany and the ECB will give them anything they want. Until they go whole hog, they won’t get full support.
This is blackmail, of course. But Monti, Samaras, and Rajoy are neoliberal reformers. So they want this too, just not the domestic political loss that goes along with it. Germany is obliging them by playing the fall guy for their domestic cutting agendas.
But, in my view, Europe is screwed. Eventually the neoliberals will have to cave and try to reflate in order to save their own hides when the debt deflation moves to the core or the Great Depression begins. They think they can extract the reforms they want before depression becomes firmly entrenched. I think they’re wrong.
3) Michal Kalecki on the Great Moderation by Steve Randy Waldman
Here is Kalecki describing with preternatural precision the so-called “Great Moderation”, and its limits:
"The rate of interest or income tax [might be] reduced in a slump but not increased in the subsequent boom. In this case the boom will last longer, but it must end in a new slump: one reduction in the rate of interest or income tax does not, of course, eliminate the forces which cause cyclical fluctuations in a capitalist economy. In the new slump it will be necessary to reduce the rate of interest or income tax again and so on. Thus in the not too remote future, the rate of interest would have to be negative and income tax would have to be replaced by an income subsidy. The same would arise if it were attempted to maintain full employment by stimulating private investment: the rate of interest and income tax would have to be reduced continuously."
Dude wrote that in 1943.
Let’s check out what FRED has to say about interest rates during the era of the lionized, self-congratulatory central banker:


Yeah, those central bankers with their Taylor Rules and DSGE models were frigging brilliant. New Keynesian monetary policy was, like, totally a science. Who could have predicted that engineering a secular collapse of interest rates and incomes tax rates (matched, of course, by an explosion of debt) might, for a while, moderate business and employment cycles in a manner unusually palatable to business and other elites? Lots of equations were necessary. No one would have guessed that, like, 70 years ago.
Woj’s Thoughts - Wow! Could Kalecki have been more correct?! Sadly our current policies are still attempting to induce further growth through a interest rate reductions (despite the zero lower bound) and lower income taxes (despite a substantial portion of the population already receiving an income subsidy). Maybe these policies can still produce another debt led boom but, the end of the road is fast approaching.

4) The Crisis in 1000 words—or less by Steve Keen
The causation behind this correlation is that money is created “endogenously” when the banking sector creates loans, and this newly created money adds to aggregate demand—as argued by non-orthodox economists from Schumpeter through to Minsky. When this debt finances genuine investment, it is a necessary part of a growing capitalist economy, it grows but shows no trend relative to GDP, and leads to modest profits by the financial sector. But when it finances speculation on asset prices, it grows faster than GDP, leads obscene profits by the financial sector and generates Ponzi Schemes which are to sustainable economic growth as cancer is to biological growth.
When those Ponzi Schemes unravel, the rate of growth of debt collapses and the boost to demand from rising debt becomes a drag on demand as debt falls. In all other post-WWII downturns, growth resumed when debt began to rise relative to GDP once more. However the bubble we have just been through has pushed debt levels past anything in recorded history, triggering a deleveraging process that is the hallmark of a Depression.
 
Woj’s Thoughts - The extreme levels of private debt can alter an economic system from being robust to fragile. In this manner, the chance that shocks destabilize the system and the magnitude of the ensuing deleveraging both increase dramatically.

Monday, July 30, 2012

Reducing the Debt-per-Dollar Ratio: A Long Road Ahead


Last week, in response to a post by Scott Sumner, I argued that Debt Surges Don't Cause Recessions...Excessive Aggregate Amounts Do. A recent post from Pragmatic Capitalism, Failing to Connect the Boom to the Bust, offers the following chart to support the importance of credit expansions in understanding business cycles:
Commenting on the post from Pragmatic Capitalism, The Arthurian comes to a similar conclusion:
During the boom you get lots of credit expansion, so total debt goes up a lot. During the bust you get little credit expansion, and total debt goes up only a little. But total debt goes up, either way. (Until the crisis, of course. And that's why there eventually is a crisis.)
There ya go: When credit expansion declines, you have recession. When total debt declines, you have depression. There's a definition for you.
Don't worry, it's not set in stone. It's not fate. It's just stupidity. We *insist* on using credit for growth. We *insist* on using credit for everything. We *insist* on using bank-issued “inside money” as our primary form of money. Change that, and we change the world forever.
Always keep in mind the ratio between inside money and outside money.
Some people want to go back to gold. Some people want 100% reserve. I just want to reduce the debt-per-dollar ratio to a workable level, and keep it there. The same system we knew and loved for 60 years, only not so extreme.
Clearly in agreement with the conclusion, I decided to explore the italicized statement above. Earlier in the post, The Arthurian said:
you can get a feel for the ratio between inside money and outside money, by looking at a picture of debt per dollar of circulating money. Or at debt per dollar of base money.
Since the graphs at those links were a bit out of date, here are the updated versions:
Debt-per-Dollar of Circulating Money

Debt-per-Dollar of Base Money


Both charts depict the persistent rise in debt-per-dollar from the 1950’s until the late 2000’s. Although the decline is pronounced in the past few years using either metric, the degree to which the ratio has retraced its 60 year rise is markedly different. Choosing the appropriate measure is therefore necessary if we are going to implement The Arthurian’s plan “to reduce the debt-per-dollar ratio to a workable level.”

Since both graphs use the same measure of total debt, the stark difference in rate of decline is clearly due to changes in circulating money (M1) versus base money (MB), shown in the following chart:
Digging a bit deeper, the sharp rise in base money over the past few years is largely attributable to an increase in excess reserves:
This chart, which is incredibly important for our discussion, suggests that the rise in excess reserves is the primary driver between the diverging rates of decline in the two measures of debt-per-dollar. Why is this important? The increase in excess reserves, engineered by the Federal Reserve, is primarily just an asset swap with private financial institutions. Since the Federal Reserve is purchasing US Treasuries and agency-MBS (liabilities of the US government), the economic sector which is really witnessing a decline in its debt-per-dollar is the US government.

Deconstructing the argument one more time, this graph again shows total credit market debt owed, now also separated out by the federal government and the private sector (blue line):
For nearly 60 years, private debt growth (credit expansion) continued unabated both in nominal terms and relative to federal debt. Although this provided a tailwind for economic growth, the legacy of accumulated debt is burdensome interest costs. While spending by the federal government is unconstrained by income, due to monetary sovereignty, the private sector is not so fortunate. When accrued interest costs (debt) become large enough, an economic shock (either exogenous or endogenous) may cause the private sector to increase savings and/or debt repayment and thereby decrease consumption and investment. If these actions are pursued in the aggregate, a “paradox of thrift” debt-deflation can take hold. In the US, this has been partially offset by the rapid rise in federal debt, but not fully given the exorbitant relative size of private sector debt.

Since private sector debt expansion and contraction has been a primary driver of the economy for at least 60 years, the debt-per-dollar ratio that best depicts the private sector should be the desired metric for policy reduction and stabilization. As shown above, the decline in debt-per-dollar of base money largely reflects an increase in excess reserves that does little to reduce the private sector debt burden. This last chart, however, displays private sector debt-per-dollar of circulating money:
Having decreased sharply since the onset of the Great Recession, this ratio remains at heightened levels only last witnessed at the beginning of the new millennium. We may still have a long way to go but reducing this debt-per-dollar ratio to a reasonable level will be worth it.