Showing posts with label GDP. Show all posts

Wednesday, February 20, 2013

(Late) 2013 Predictions

Last year I took a chance and threw my own projections into the ring. Similar to Byron Wien and Edward Harrison, I mostly selected events that were widely seen as having a low probability (less than 33%) but which I believed held a greater than 50% chance of occurring. The final results were a bit disappointing, but that won’t stop me from trying again this year. Since these predictions already represent a late release, without further adieu, here are the 2013 predictions:

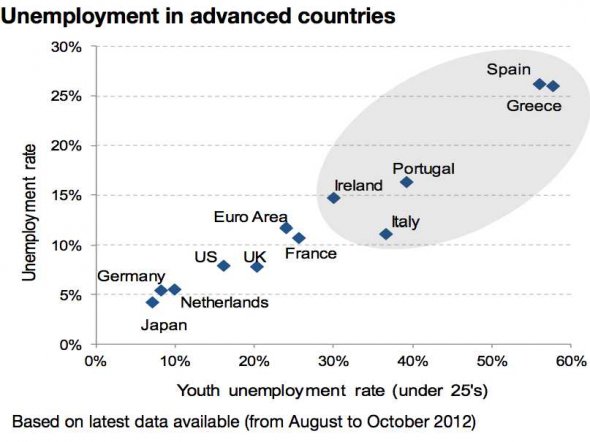
1) Spain requests access to ECB’s OMT - Since ECB President Mario Draghi announced the OMT program, yields on Spanish debt have fallen rather dramatically. Although this eases financing pressure, it has done little to alter the actual economy’s downward spiral. During 2012 Spain’s GDP growth became increasingly negative, falling by 1.8% year-on-year in the fourth quarter. Meanwhile unemployment continues its meteoric rise to over 26% for the general population and nearly 60% for youth. With the large banks still severely undercapitalized and households over-indebted, private sector lending continues to decline:


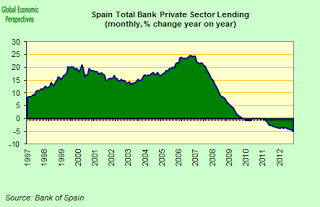
Seeing no recovery and potentially a worsening decline, “bond vigilantes” will eventually test Draghi’s threat. At that point Spain will be forced to accept a Memorandum of Understanding (MoU) in return for ECB bond-buying through the OMT program.

2) The Euro finishes the year above $1.30 - After falling nearly 10% during the first half of 2012, the euro has more than recouped its losses on the back of optimism and deflationary policies.

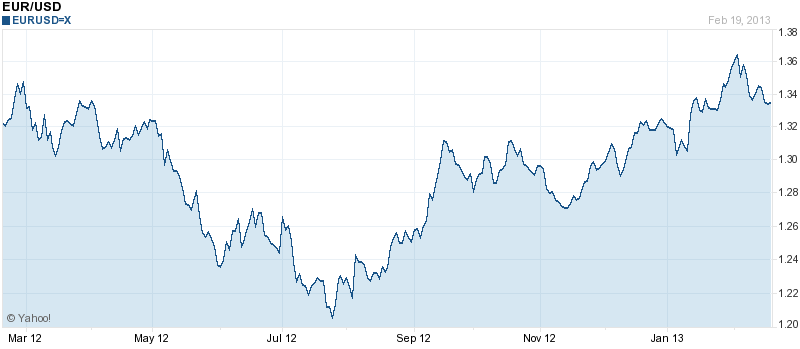
At points during 2013 the optimism is likely to fade, but I expect politicians and central bankers will take the necessary steps to quell fears for the time being. Unfortunately those steps will involve further deflationary policies that push the euro higher. These competing forces will largely cancel out, leaving the euro close to or above where it began the year.

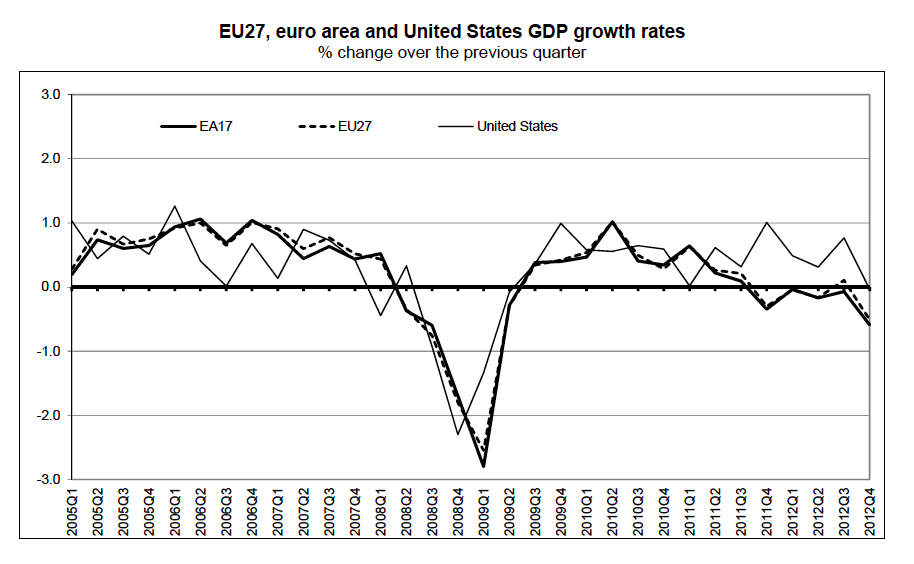
3) The Eurozone remains in recession the entire year - Forecasters now expect euro-zone economic activity to be flat this year, down from a previous prediction of 0.3% growth made just three months ago. Last year saw practically continuous downgrades to GDP growth forecasts and I expect this year to be no different. Austerity measures are momentarily easing, but more will likely be enacted based on the outcomes of several elections. The recent appreciation of the euro against several major currencies will also dampen growth by putting pressure on net exports. With banks across Europe trying to build up capital and persistently high unemployment, the private sector will remain especially weak. Though Germany may experience a temporary rebound, the Eurozone as a whole will not register GDP growth this year.

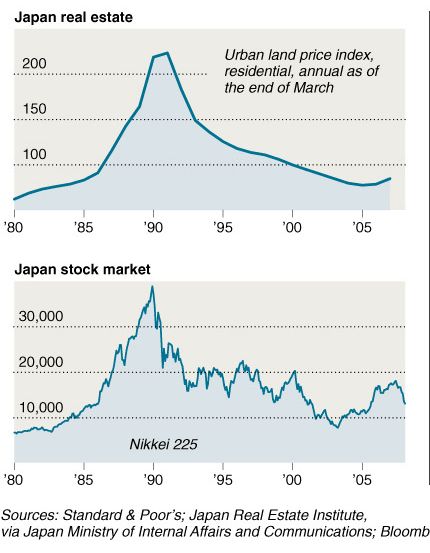
4) The Japanese yen rises above 90 per $ - Since the election of PM Shinzo Abe, the yen has fallen fast and is down more than 20% from recent highs.

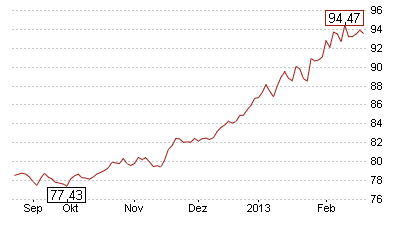
During this time the Nikkei has risen more than 20%, yet yields on Japanese sovereign debt are little changed. This suggests many foreigners may be speculating on the supposedly forthcoming monetary and fiscal stimulus. As previously stated, the fiscal stimulus will probably be small and short-term. On the monetary front, short of actually entering the foreign exchange market, the Bank of Japan (BOJ) has essentially no mechanism to spur inflation and thereby cause a sustained depreciation of the yen. When market participants recognize the inability of Japan to avoid continued deflation, the yen will return to appreciating against the dollar.

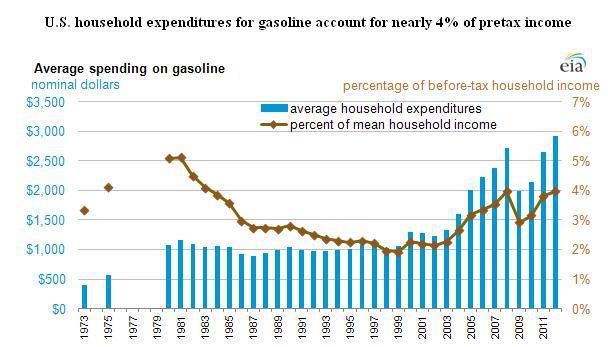
5) Gas prices will peak above $4.20 per gallon and set a new yearly record-high average above $3.75 per gallon - Gasoline prices have been on the rise for the past 31 days, currently averaging approximately $3.75 per gallon. Though this current streak will probably end soon, prices are unlikely to give back much of the gains before beginning the typical rise into summer. The ongoing potential for flare ups in the Middle East will keep prices elevated throughout the year. Higher gas prices, which already account for 4% of before-tax household income (chart below), will be a drag on consumer spending in 2013.


6) U.S. Yearly GDP growth falls below 1.5% - Forecasts of ~3% annual GDP growth over the past couple years have been overly optimistic as real growth in 2011 and 2012 was merely 1.6% and 1.9%, respectively. Apparently forecasters are being a bit tamer in their estimates this year, now expecting only 2% annual growth. Unfortunately I suspect these estimates will once again prove too optimistic. Various tax hikes and the upcoming sequester (which will go through in some respect) will reduce the budget deficit by a few percent this year. Housing is likely to remain a bright spot, but further declines in interest rates will not lead to similar magnitudes of the wealth effect. Credit remains tight for many households and small business, which should also limit private sector activity. All of these factors combined will probably not be enough to bring about a new recession but will lead to the lowest annual growth rate during this upswing.


7) U.S. Unemployment rises above 8% - Currently sitting at 7.9%, the unemployment rate is forecast to decline during 2013. Due to weaker GDP growth, corporate revenues will barely rise again this year. As companies face increasing pressure to maintain profit margins at record levels, a new wave of layoffs may occur. Separately, continuing economic growth will encourage previously discouraged workers to re-enter the job market. Both of these factors will lead to slightly higher measured unemployment.

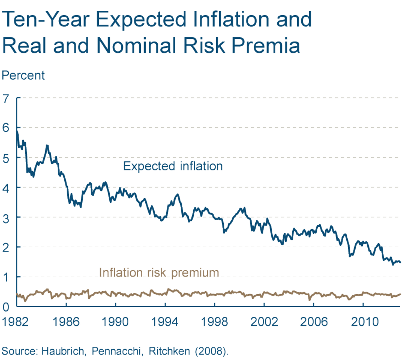
8) Federal Reserve forecasts shift first rate hike to 2016 - After extending their forecast for the first rate hike to 2015, the Federal Reserve changed its tactics to a more rule-based monetary policy. The Fed has, in effect, promised to keep rates low until we've hit either 6.5 percent unemployment or 2.5 percent inflation. Based on the above outlook for unemployment and a continuing decline in inflation expectations (chart below), FOMC members will revise their own forecasts and push back expectations for the first rate hike.


9) U.S. Corporate Earnings (ex-Federal Reserve) finish year below 2012 peak - Meager revenue growth was not enough to prevent U.S. Corporate Profits after tax from reaching record highs in the fourth quarter of 2012 on the back of record profit margins. US Corporate Profits After Tax Chart

As global growth slows in 2013, revenues will come under further pressure. At this point the ability of firms to continue cutting costs without sacrificing output seems limited, which means margins may begin to compress. As margins revert to previous norms, earnings will register a yearly decline.

10) Bonds outperform stocks - During the first seven weeks of this year the stock market has been on fire, even though earnings estimates continue to fall.


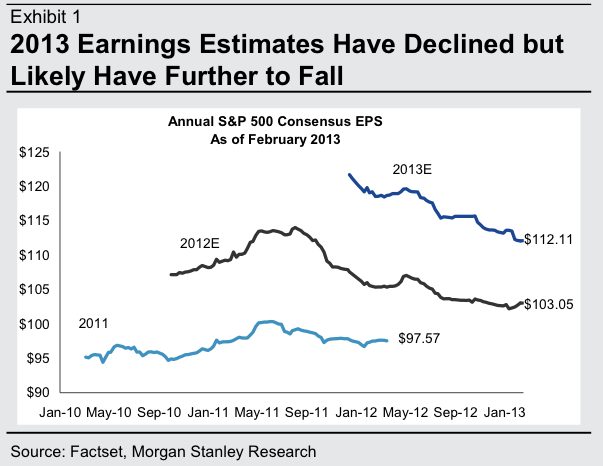
Multiple expansion is currently being driven by the Federal Reserve’s actions despite their ineffectiveness at generating actual NGDP growth. When investors eventually turn their attention to continuing troubles in Europe, ongoing deflation in Japan, and/or weakening growth in China, U.S. earnings may once again enter the picture. Recognition that S&P 500 earnings growth has slowed substantially may cause the market to give up much of this year’s gain. These concerns combined with declining inflation expectations will result in many investors returning to the safety of U.S. Treasuries. The subsequent rise in prices (decline in rates) will generate another year of positive returns for the Treasury market.


Will my predictions prove too pessimistic once again? Only time will tell...

Thursday, February 14, 2013

European Markets and GDP Move in Opposite Directions during 4th quarter


With data now confirming Europe’s awful fourth quarter on the GDP and unemployment front, it may be time to reconsider whether recent optimism is truly warranted...

Europe's A Fragile Bubble', Citi's Buiter Warns Of Unrealistic Complacency courtesy of Zero Hedge

We recognise that, in a decentralised market economy where expectations of the future, moods, hopes and fears drive private (and sometimes also government) behaviour directly and through their effect on the prices of real and financial assets, today’s subjective expectations and other psychological characteristics in part determine what tomorrow’s fundamentals will be.
Irreversible or costly-to-reverse decisions like capital expenditure, human capital formation, resource extraction etc, are driven by subjective expectations and moods, making the distinction between a fundamentally warranted asset boom and a bubble slightly fuzzy at the edges.
But this indeterminacy, bootstrapping, self-validating characteristic of complex dynamic economic systems inhabited by partially forward-looking households, firms and policy makers – called reflexivity by George Soros – can be taken too far.
Mere optimism and confidence will not permit the authors of this note to bootstrap themselves into winning the men’s doubles at Wimbledon 2013. The fact that financial markets have radically reduced their implied estimates of the likelihood of sovereign default in the periphery of the EA (other than in Greece) and of senior unsecured bank debt restructuring throughout the EA, core as well as periphery, should not stop us from continuing to analyse carefully the fundamental drivers of both sovereign credit risk and senior unsecured bank debt credit risk. When we do this, the conclusion that the markets materially underestimate these risks is, in our view, unavoidable.
Woj’s Thoughts - Actions by central bankers and politicians in the Euro Area, U.S., and Japan are increasingly betting on the fact that optimism and confidence alone will solve the problems underlying the presently weak economic growth. On this matter I side with Buiter in thinking markets have gotten well ahead of economic realities, especially in the Euro Area periphery. Recent flare-ups highlight the ongoing undercapitalization of banks and the inability of fiscal policy to either reduce unemployment or meet given targets. Political fallout from recent scandals and a strengthening euro may reignite the EU crisis.

Tuesday, November 13, 2012

A Minor GDP Revision with Major Consequences

The value of national accounting identities in economics and as a means of qualifying the wealth of a nation has recently been a frequent topic of personal discussions. Hence I was excited by Euvoluntary Exchange’s critiquing GDP vs. EE, in which Samuel Wilson takes on the conventional accounting of exports and imports:
Where GDP is usually referenced by economists and the press is as a proxy for the health and vitality of the economy. Higher GDP per capita tends to correlate well with higher standards of living and better material well-being. There are quite a few things folks consider desirable that track well with high GDP, like lower violent crime, longer life expectancy, lower infant mortality, et al. That's great, but if we're measuring prosperity, it seems kind of perverse to ding your metric for exchanges that happen in one particular direction across one particular type of border. By using GDP as a proxy for prosperity, the deck is sort of stacked against the euvoluntarity of international trade, and this is completely independent of any intertemporal, loanable funds considerations. It's almost tacitly suggesting that imports are something we have to suffer for the privilege of exporting. How strange.
I can perhaps understand how economists might want to concern themselves with prosperity maximization. I'm more puzzled by ones who translate this to "GDP maximization".
I'm sort of curious if folks' moral intuitions towards overseas trade would change if some snickering rogue could convince the profession to switch the sign on imports.
GDP is clearly focused on production (given the acronym), yet intuitively one might consider wealth as the amount of obtainable goods and services. The focus on production appears to mesh well with Say’s law, in which production is the means by which individuals can obtain other goods. However, there are numerous reasons to question the validity of Say’s law including the possibility of an excess demand for money. Rejecting Say’s law, one can more readily accept that production is not the only, or necessarily accurate, means of determining one’s purchasing power.

Warren Mosler, a main proponent of MMT and a sectoral balances approach to macroeconomics, presents a similar argument in his book Seven Deadly Innocent Frauds of Economics Policy (p.59 - free pdf version attached):

Imports are real benefits and exports are real costs. Trade deficits directly improve our standard of living.
Put more succinctly: The real wealth of a nation is all it produces and keeps for itself, plus all it imports, minus what it must export.
Wilson and Mosler clearly agree that reversing the GDP accounting sign on imports and exports would more accurately reflect the “real wealth of a nation.” That these two proponents affiliate with generally opposing economic camps, suggests optimism that many others might support this change. The road won't be easy, but reversing the sign on imports is critical to preventing this “deadly innocent fraud” from further reducing our standard of living.

Wednesday, July 11, 2012

Two weeks off...little has changed

I’m back! After ten much needed days of vacation (largely without internet) and a couple days feeling under the weather, Bubbles and Busts is back.

Catching up on the news feed was a bit tedious as it appears a lot has happened, yet made very little difference. The Euro Summit, as predicted, offered the impression that progress was being made and momentarily provided an all-clear for risk-on betting. However, similar to the other 20-something summits, once the details began to leak out it became widely recognized that minimal real progress had been made. The timetable and size of the Spanish bank bailout are both unrealistic. Meanwhile, the negative effects of further attempts at austerity (tax hikes and spending cuts) are only slightly offset by the upward revisions in allowable public deficits for this year and next (which Spain will still not meet).

Separately, data out of China continues to suggest that growth is slowing much quicker than many expected. Falling inflation allowed the Chinese central bank to cut rates, but that action will do little to spur consumer spending (or boost growth). The Chinese government is increasingly facing the tough decision of whether to promote structural rebalancing and allow growth to slow or to put of rebalancing and jump start growth with fiscal stimulus. This decision will likely have a large impact on markets in the short-run and it appears most US investors are betting on the latter outcome.

Lastly, US economic data has also been weakening, topped off by the poor employment report last Friday. Yes the warm winter pulled economic activity forward, but I’m also convinced that the timing of the 2008-2009 crisis has altered the seasonal adjustments in a manner that overstates fall/winter months and understates spring/summer months. Regardless, 2Q GDP growth is likely to be below the already meager 1.9% growth during the 1Q. Corporate profits are now feeling the effects and have already turned negative (q/q). Both full-year GDP and S&P earnings expectations remain overly optimistic and will likely be trimmed over the coming weeks.

On the whole, global growth is clearly slowing and politicians in all of the major regions appear to be merely reacting, belatedly, to problems that surface. US stock markets have now given back most of the initial gains from the EU summit and Treasury yields are holding at or near all-time lows across the curve. Peripheral sovereign yields in the Eurozone have received a bit of a bid the past couple days (from the ECB?) but remain at unsustainable levels. Given the recent actions, my bias remains pessimistic for the next 1-2 years. Now it’s time to get back to more in-depth blogging...  

Friday, June 22, 2012

Warren Mosler on Stagnation in Europe, US growth and China's Potential Hard Landing

Great interview here with Warren Mosler. In his eyes, government deficits in Europe and the UK are now large enough to stabilize GDP but not promote growth. Meanwhile the US deficit will remain high enough to support ~2% growth. As for China, Warren notes that throughout history practically all attempts to rein in inflation have resulted in hard landings. Overall this suggests little concern for stocks at current levels.

Apart from the discussion of growth relating to stocks, Warren also provides his usual great insight on the actual monetary operations of our nation (and others). More specifically, he discusses the ineffectiveness of monetary “stimulus” due to lost interest income, the ECB’s back stop of illiquid (maybe insolvent?) banks and the role of deficits in supporting aggregate demand. These topics and more are presented in an extremely clear, concise manner in Warren’s book The 7 Deadly Innocent Frauds of Economic Policy (which I’m currently reading free online).

Thursday, March 29, 2012

The Economy Needs a Bubble, but Treasuries are NOT it!

Yesterday, using the help of Nick Rowe and Michael Sankowski, I described why The Economy Needs a Bubble! The basic premise was that when the interest rate, r, is below growth, g, there is a larger than normal demand for money to spend and invest. Fulfilling this excess demand often results in an expansion of money-like instruments, which feeds on itself and ultimately forms a bubble. Although this relationship is broadly understood, most economists assume that this situation rarely occurs.

Proving this point, in a recent post titled Shadow Banking, Bubbles and Government Debt, Karl Smith writes (my emphasis in bold):

“While its possible that the interest rate on T-Bills averages only 3.3% over the next 30 years this is – hopefully – extremely unlikely. It implies that nominal GDP growth will average 3.3% over the next 30 years, as the Fed must ultimately align interest rates with nominal growth rates or the economy will persistently overheat or stagnate.”
Smith clearly recognizes the effect of holding interest rates below growth, but assumes this is will not happen over a 30-year period. If the belief that T-bill rates (and nominal GDP growth) average more than 3.3% for the next 30 years comes true, than long-term Treasury bonds are certainly overpriced (yield is too low). Stemming from this view, Smith claims:
“US Government debt is in a bubble.I am coming to believe that bubbles are a persistent feature of  the modern global economy and extend from the fact that the world is aging.”
Summing up Smith’s view, our economy experiences frequent bubbles but since interest rates and nominal growth are ultimately aligned, an aging economy is the likely reason. But here’s the trouble, why should we assume interest rates and nominal growth align over time? Using Bloomberg I pulled up the following charts displaying quarterly data of the Federal Funds Effective Rate (FEDL01) and US Nominal GDP growth, year-over-year and seasonally adjusted (GDP CURY), for the past 50 years.    


The top chart shows the actual levels for both data series while the bottom chart depicts the spread between nominal GDP growth and interest rates. Within the bottom chart, green areas represent periods where the interest rate was less than the nominal growth rate (r < g). What may be a surprise to many, apart from a period between 1979 and 1991, interest rates are almost always below the nominal growth rate. In fact, over the last 50 years, interest rates on average were more than 1% below the rate of nominal growth.

A simple look at empirical data clearly shows the assumption that interest rates and nominal growth align over time to be false (at least within a 50-year time frame). Combining this data and  Smith’s own analysis, our “economy will persistently overheat or stagnate.” Interestingly, only looking at the past 20 years of data, interest rates were on average 1.4% below the nominal growth rate, which happened to be 4.7%. Current 30-year Treasury rates of 3.3% are therefore exactly what investors should expect, if the next 20 years actually resemble the previous 20. While one should not expect a replica of the past 20 years, one thing is certain, Treasuries are NOT in a bubble!

Wednesday, March 28, 2012

The Economy Needs a Bubble!

Nick Rowe, in Do we need a bubble?, states that economics generally assumes that “in a normal world, the equilibrium rate of interest [r] is above the growth rate [g] of the economy.” However, by this definition, our world is often and currently not in a normal state. With US inflation currently near 2% (core CPI) and the 10-year treasury bond yielding 2.2% (as of this writing), the real interest rate (risk free rate minus inflation) is just slightly positive. Meanwhile, nominal GDP in the 4th quarter of 2011 was 3.8%, meaning the real growth rate (nominal GDP minus inflation) is closer to 2%. (Note: Reported US data typically uses different rates of inflation for real GDP, but I used the same statistic here to simplify). When growth outpaces interest rates, the environment is ripe for borrowing money to invest and consume.

During these supposedly abnormal periods the demand for money is high. If this demand is not met with supply(e.g. through government deficits) or reduced (e.g. increased taxes), than people will seek out money-like instruments. Michael Sankowski notes that money-like instruments can be as simple as “stocks being used to purchase real world goods, or using the paper value of real estate as collateral to purchase real world goods. Increasing demand for these instruments drives prices higher, which in turn, boosts their value as money-like instruments. This creates a self-fulfilling upward cycle in both demand and price. Therefore, “as long as the real growth rate is higher than the real interest rate, the economy will demand bubbles.” (Graph below from The supply and demand for bubbles (in pictures))

Americans experience during the past 20 years should bear out this fact since the economy has seemingly moved from one bubble to the next (e.g. dot-com, real estate, commodities). As we speak, stocks and commodities may once again be providing the bubble our economy desires. In contrast to the US experience, Japan’s economy has resembled a ‘normal’ world for much of the past 20 years. Deflation has largely kept the real interest rate (using 10-year JGB yields) in the 1-2% range, while real growth rates were frequently between 0-1%. This environment encourages reduced borrowing and, by extension, less desire for money-like instruments. The result has been real estate and equity markets that dropped over the entire period. (Graph from Dr. Housing Bubble)


While the economy may frequently desire bubbles, these are a sign of private sector waste (inefficiency) that always results in wealth destroying busts. Within Post-Keynesian schools of economic thought, both the interest rate and inflation can be controlled, to a degree, by the combination of fiscal and monetary policy. Accepting that our economy is often in an abnormal state is the first step to alleviating the economy’s need for a bubble.  

Thursday, September 1, 2011

Guest Post: One Death is a Tragedy, One Million is a Statistic

At this point, most readers are likely aware of my skepticism towards broad headlines and general government statistics. For those seeking greater insight into the ways GDP misrepresents economic well-being or other similar issues, I suggest reading the free book, Mismeasuring Our Lives: Why GDP Doesn't Add Up by Joseph Stiglitz, Amartya Sen and several others. In the meantime, Peter Tchir of TF Market Advisors, details a few of the recent headlines and dives into the actual calculations that should provoke such skepticism. Although I don't have a specific tally, weekly initial jobless claims have been revised higher nearly every week for the past year (if not more). An interesting side note on the topic, during the past two weeks these claims were supposedly higher than normal due to a significant number of Verizon employees filing for unemployment insurance. While the report only counts claims filed, I'm curious whether any employees that willingly went on strike received unemployment benefits.

Tchir, whose posts I look forward to daily, also offers pertinent information about channel stuffing, inventory builds and the statistical significance of non-farm payroll reports. In my opinion, these topics only scratch the surface or questionable data mining and reporting. Here are a few other topics that deserve further consideration:

1) GDP is calculated in two different formats by the BEA. Why do the measures deviate from one another?
2) The BEA also uses a GDP deflator to represent inflation and convert nominal GDP to real GDP. The BLS calculates inflation as CPI. The Fed prefers to use PCE (personal consumption expenditures) when measuring inflation. All three tend to deviate from one another and at least recently the GDP deflator has been the lowest (CPI or PCE measures would likely have shown negative real GDP growth in Q1 and Q2). Why are there several different measures, used for different purposes?
3) On average, S&P 500 companies tend to report quarterly earnings that exceed analyst estimates 60 to 75% of the time regardless of the macroeconomic environment. Why are these estimates consistently wrong in the same direction?
4) Analysts and investors frequently highlight cash on the balance sheet as a sign of strength in corporate America. However, a company that borrows $1 million in cash certainly does not have a stronger balance sheet than another company with no cash or debt. Why is the size of debt never considered when discussing the amount of cash?

There are certainly countless other statistics that could be included in this list and are deserving of further research and transparency. Too frequently these statistically insignificant data points are directing policy and allocation of capital to the detriment of the larger economy. Continuing the discussion Stiglitz and others hoped to incite will ideally lead to policies that better address the economic and personal well-being of society.


Guest Post: One Death is a Tragedy, One Million is a Statistic:
Submitted by Peter Tchir of TF Market Advisors

One Death is a Tragedy, One Million is a Statistic

Another day of statistics, where the headlines are widely published, some details are somewhat explored, and in-depth analysis is next to nil.

The initial jobless claims number has become a farce. It is virtually statistically impossible for this many upward revisions unless the data is purposely under reported. I can understand the desire to smooth data, or make it seem better, but at some point the line of credibility is crossed. Not only do they screw with the main statistic, but they seem to use continuing claims as a secondary diversion. Last week’s 3641k continuing claims seemed statistically implausible, yet it was cheered. The doom and gloom crowd argued that it must be from people using up eligibility, in the end, it was just wrong by over 100k, according to today’s release. How is that possible?

Next we move to auto sales. It is hard to avoid hearing about auto sales today, probably, because the headline numbers seem good. I can almost ignore the fact that the first thing mentioned is the percentage change from a horrible period last year, but I am shocked the focus is still on total sales. Since at least 2005, the problem with car companies has been selling cars at a profit, not just selling cars. Nothing from the data indicates how profitable the sales are. So we can cheer this headline, but to a large degree it is meaningless. Then, making it more meaningless, is the fact that it includes fleet sales and is really based on sales to dealers. It doesn’t give a clear picture of how many cars were driven off the lot by bona fide, actual, human owners. If anything, the hype surrounding these figures rewards channel stuffing. There seems to be a degree of confusion by those spouting the numbers about the lack of follow through in the stocks. Maybe stocks have finally learned the lessons from these numbers, but it would be great if the masses were presented with details and useful statistics rather than just what the auto companies want to hype.

Then there was the ISM Manufacturing data. The sighs of relief from trading floors shook the buildings almost as much as last week’s earthquake. Where to begin with this data? It is a “diffusion” index. So it treats each respondent’s answer the same. It doesn’t matter if a company has 5 employees, or 5,000, their answer counts the same in the survey. If the often unreliable ADP report is correct that most of the hiring is occurring at small and medium companies, does that impact ISM?

If 2 small companies report better conditions, and 1 large company reports worse conditions, then the diffusion index would be 66, but the real world impact might be a lot different. Size does matter. Maybe that is part of the reason we see a discrepancy between regional surveys and the national survey? Does ISM report diffusion indices based on size? It would be interesting, at the very least, to see if there is a dramatic difference between big and small companies.

The next thing about the ISM methodology that I find interesting, is that the positive responses include positive responses and ½ of unchanged responses. I guess that is necessary to make a diffusion index, but I would like to see if it is realistic. Do “unchanged” responses have a tendency to follow the trend the following month? I could easily see someone who reported improving conditions one month being inclined to report unchanged the next month, even if conditions were actually worse. These are surveys done by people like you and me, well actually by people with “survey filler outer” included in their job description.

I’m not saying that having the data broken down more precisely would change the market reaction, but I don’t see why it isn’t available, and I don’t see why more analysts aren’t demanding that data. We can all look at a headline, but the value comes from those who can figure out what is going on behind the scenes. If there have been structural changes in the economy (and I believe there have been), then knowing more details would be helpful. The old rules of thumb may be deceiving us.

Of the 5 components, I am most confused by inventories. Inventory growth strikes me as highly suspect. I can see times where it is indicative of future economic growth as companies prepare for increased demand, but equally, it strikes me that it could represent a sudden slow down in final demand resulting in an unexpected inventory build. Had inventories remained unchanged, we would have seen a sub 50 print. You can’t convince me easily that inventory build last month was a positive indicator, yet that is what the headline would have you believe.

This is all in advance of tomorrow’s NFP report. NFP holds a special place in the dubious statistic category. First we have the fact that there are two separate surveys. We have the establishment and the household. The establishment survey is statistically significant for changes of 100,000; whereas the number is 400,000 for the household survey. In this day and age where virtually everything is done on the internet, I bet Google or Facebook could probably produce a more accurate report within a few months if either one bothered. Until that time, we are stuck with 2 sources of data, both of which have wide margins for error. Then we have the fact that for many months, the birth/death model generates more jobs than the headline itself. That wouldn’t be bad if it didn’t seem to require annual revisions lower. Once again the consistency of the annual revisions indicates that the reports are designed to produce numbers more positive than the reality in the hopes that by the time it is adjusted down, the market has moved on. Having said all of that, the market, or at least the analysts will try and distinguish between 40,000 and 80,000 when the difference is not actually significant or verifiable. They will latch on to whatever survey provides the most positive spin. Those who said the household survey matters more than the establishment survey, will find equally compelling reasons why it is now the establishment report that matters, or vice versa. Obama will be talking about jobs next week, so no matter what number comes up, expect it to be cited often over the next week.

I just realized, the president will be speaking about jobs and more handouts right before the start of the NFL season. Even Stalin might blush at trying to use bread and circuses so obviously.