Households and businesses “with access to cheap borrowing” have been pouring money into stock, bond, housing and commodity markets rather than investing in tangible capital. The remarkable rise in asset prices has unfortunately not funneled down to households in the bottom four quintiles of income and wealth, only furthering the inequality gap.Cullen Roche addressed a similar issue yesterday in a post on The Fed’s Disequilibrium Effect via Nominal Wealth Targets:
Fed policy and the monetarist perspective on much of this can be highly destabilizing by creating this sort of ponzi effect where asset prices don’t always reflect the fundamentals of the underlying corporations. It’s not a coincidence that we’ve have 30 years of this sort of policy and also experienced the two largest nominal wealth bubbles in American history during this period.The title of this blog is also not a coincidence, since my formative years encompassed both the dot-com and housing bubbles. My relatively limited experience with financial markets and macroeconomics (based on age) has been punctuated by financial instability. These memories are the driving factor behind my desire to study financial instability and inform policy decisions that can stabilize the business cycle.
In a recent post on The Spinning Top Economy, Matthew Berg helps further my goal with insight on measuring financial instability (my emphasis):
Now we have Government IOUs on the bottom, serving as the base of the economy. Bank and Non-Bank IOUs are leveraged on top of those IOUs – somewhat precariously.
In fact, you can think of the economy as a spinning top rather than a pyramid. Like a spinning top, the more top-heavy the economy becomes, the greater its tendency to instability, and the more readily it will topple over and collapse in a financial crisis.

Now, what happens if, as was the case during the dot-com bubble and the housing bubble, private sector net financial assets go negative but net worth continues to grow?
In fact, the difference between the measures of net financial assets and net worth provides us with a good rule of thumb for how to spot a bubble economy. If private sector net worth is growing at a greater rate than private sector net financial assets are growing, then that means that the economy – symbolized by our spinning top – is growing more top-heavy.
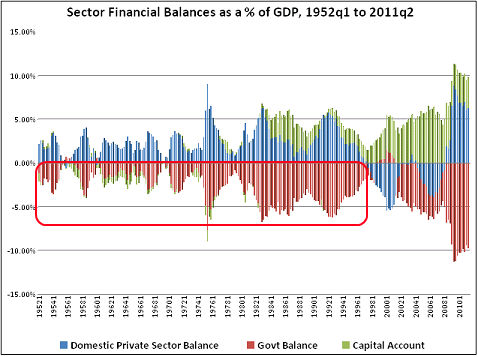
So, what happens if we make the spinning top more top-heavy? You can go ask your nearest Kindergartener – it becomes more likely to topple over.Since Matthew provides the guidelines for spotting “a bubble economy,” let’s take a look at the empirical data to see how well it aligns with the story. The first chart displays the growth rates of private sector net financial assets (NFAs) and private net worth over the past 20 years*:
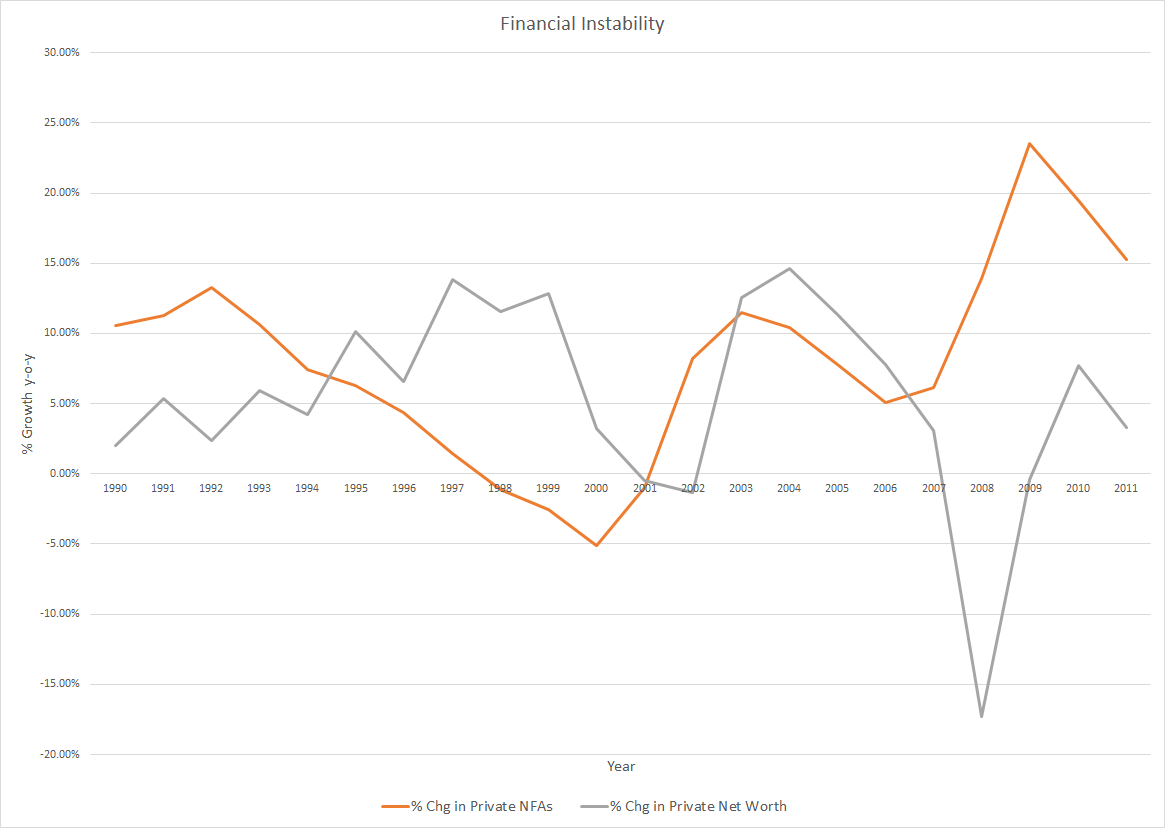
The negative growth rate in private NFAs corresponds with the Clinton surpluses, while the two positive surges are due to the Bush tax cuts and Bush/Obama stimulus measures. Turning to the growth in private net worth, the brief decline stems from the bursting dot-com bubble and the massive drop from cratering house prices. Combining the two measures will show when/if the economy was becoming “top-heavy” (first chart displays the past 50 years; second chart is the same data but only the past 20 years, for clarity):
Past 50 Years
Past 20 Years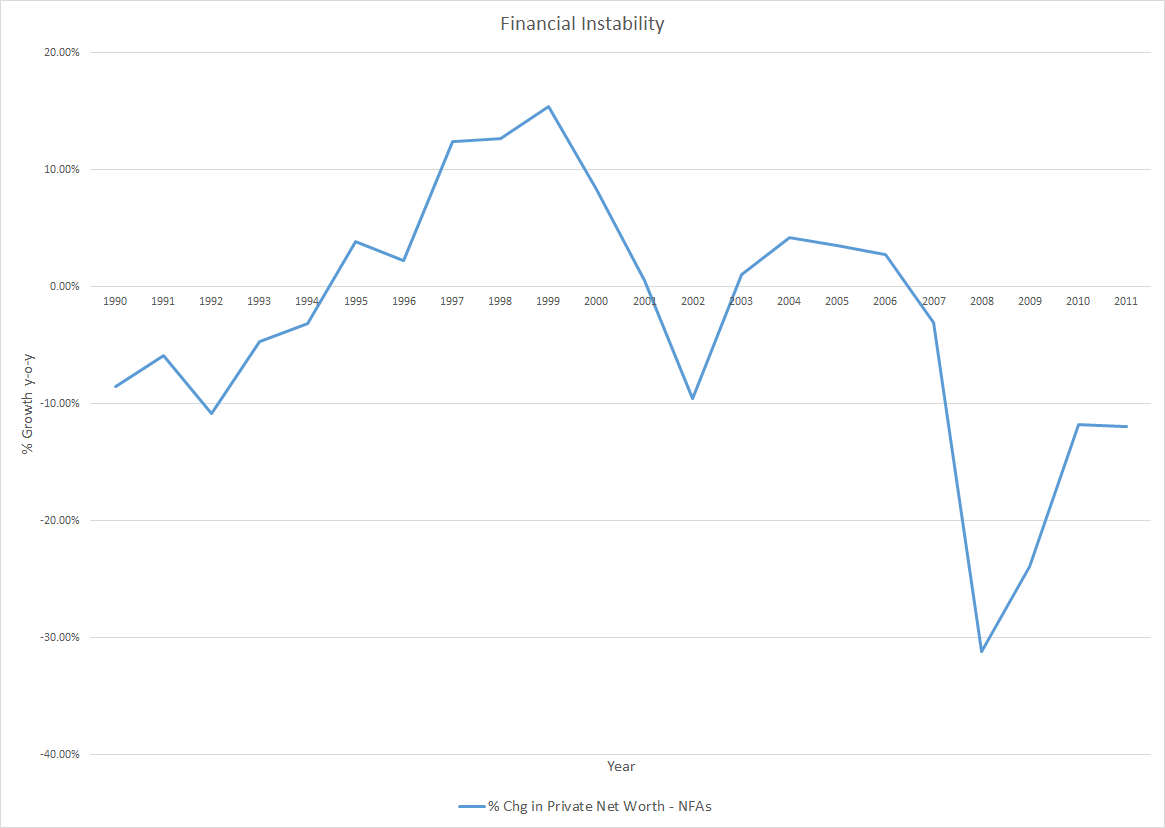
Growth of private net worth began outpacing the growth of private NFAs in 1995 for the first time since 1979. The difference in growth rates then remained positive for 10 of the next 11 years. This streak is truly remarkable given that prior to 1995, the difference had only been positive in five other years dating back to 1961.** At the end of 2006, the U.S. economy was clearly more “top-heavy” than any previous time in the post-war era. Over the past three decades, growth in private debt exceeding income and declining nominal interest rates have generated enormous returns for asset holders. Throughout the 1980’s and early 1990’s, federal deficits provided more than enough NFAs to keep pace with rising private net worth. Then, in 1995, deficits began decreasing just as the growth of net worth (and private debt-to-GDP) began accelerating higher. The unsurprising result has been more than a decade of meager asset returns, subpar economic growth and high unemployment.
The government policy of targeting nominal wealth, driven by an expansion of private debt, has failed not only at increasing net worth but also, and more importantly, at creating sustainable growth in output and employment. Going forward the focus of policy must return to promoting the growth of income and assets, which in turn will fuel higher output, employment and ultimately wealth.
*Data for private net worth comes from the Federal Reserve’s Flow of Funds Accounts of the United States (Z.1). Data for private net financial assets (NFAs) comes from the National Income and Product Accounts (NIPA) at the BEA.
**Aside from 1979, growth of private net worth exceeded the growth of private NFAs in 1961, 1965, 1969 and 1978 (0.05%).
Related posts:
The Rise of Debt, Interest, and Inequality
Fear of Bubbles, Not Inflation, Returns to the Fed
Why the Federal Reserve Mandate Means That Bernanke Doesn't Have to Worry About Bubbles